Troubleshoot Vault
Troubleshooting is a fundamental task for Vault operators, but catching an error with Vault can be a complex exercise. Vault connects to a number of other systems, which can make issue resolution difficult.
Vault issues can result in a cluster of emitted error messages, and getting to the root cause of the issue may take some time.
This resource details some general approaches for making sense of Vault errors by reproducing the error, parsing the logs, checking the error source, and reviewing external resources.
- Vault Logs
- Troubleshoot the storage
- Troubleshoot common HTTP API and client errors
- Troubleshooting approach
- Troubleshooting tools
- Help and Reference
Vault logs
Vault has two types of logs - Vault server logs and audit logs. The audit logs record every request made to Vault as well as the response sent from Vault. The server logs are operational logs that give operators insight into what the server is doing internally and in the background as Vault runs.
Logging is useful when you are troubleshooting because it provides context for the issue. You can learn the Vault server configuration, as well as the actions Vault tried to take in the moments that precede the error, which provides an insight into fixing it.
Audit logs
Audit devices are the components in Vault that responsible for managing audit logs. Every request to Vault and response from Vault goes through the configured audit devices. This provides a simple way to integrate Vault with several audit logging destinations of different types.
The generated audit log has every authenticated interaction with Vault including errors. There is an audit log entry for each request and its response, a compressed JSON object that looks like this:
...snip...
  "time": "2019-11-05T00:40:27.638711Z",
  "type": "request",
  "auth": {
    "client_token": "hmac-sha256:6291b17ab99eb5bf3fd44a41d3a0bf0213976f26c72d12676b33408459a89885",
    "accessor": "hmac-sha256:2630a7b8e996b0c451db4924f32cec8793d0eb69609f777d89a5c8188a742f52",
    "display_name": "root",
    "policies": [
      "root"
    ],
    "token_policies": [
      "root"
    ],
    "token_type": "service"
  },
  "request": {
    "id": "9adb5544-637f-3d42-9459-3684f5d21996",
    "operation": "update",
    "client_token": "hmac-sha256:6291b17ab99eb5bf3fd44a41d3a0bf0213976f26c72d12676b33408459a89885",
    "client_token_accessor": "hmac-sha256:2630a7b8e996b0c451db4924f32cec8793d0eb69609f777d89a5c8188a742f52",
    "namespace": {
      "id": "root"
    },
    "path": "sys/policies/acl/admin",
    "data": {
      "policy": "hmac-sha256:212744709e5a643a5ff4125160c26983f8dab537f60d166c2fac5b95547abc33"
    },
    "remote_address": "127.0.0.1"
  }
}
{
  "time": "2019-11-05T00:40:27.641524Z",
  "type": "response",
  "auth": {
    "client_token": "hmac-sha256:6291b17ab99eb5bf3fd44a41d3a0bf0213976f26c72d12676b33408459a89885",
    "accessor": "hmac-sha256:2630a7b8e996b0c451db4924f32cec8793d0eb69609f777d89a5c8188a742f52",
    "display_name": "root",
    "policies": [
      "root"
    ],
    "token_policies": [
      "root"
    ],
    "token_type": "service"
  },
  "request": {
    "id": "9adb5544-637f-3d42-9459-3684f5d21996",
    "operation": "update",
    "client_token": "hmac-sha256:6291b17ab99eb5bf3fd44a41d3a0bf0213976f26c72d12676b33408459a89885",
    "client_token_accessor": "hmac-sha256:2630a7b8e996b0c451db4924f32cec8793d0eb69609f777d89a5c8188a742f52",
    "namespace": {
      "id": "root"
    },
    "path": "sys/policies/acl/admin",
    "data": {
      "policy": "hmac-sha256:212744709e5a643a5ff4125160c26983f8dab537f60d166c2fac5b95547abc33"
    },
    "remote_address": "127.0.0.1"
  },
  "response": {}
}
...
Enable an audit device
When a Vault server is first started, no audit devices exist. You must enable audit devices with a privileged user token with the following ACL policy capabilities:
# 'sudo' capability is required to manage audit devices
path "sys/audit/*"
{
  capabilities = ["create", "read", "update", "delete", "list", "sudo"]
}

# To list enabled audit devices, 'sudo' capability is required
path "sys/audit"
{
  capabilities = ["read", "sudo"]
}
To enable an audit device, execute the vault audit enable command.
Example:
The following command enables the audit device, file at the file/ path. Vault
write audit entries to the /vault/vault-audit.log file.
$ vault audit enable file file_path=/vault/vault-audit.log
Success! Enabled the file audit device at: file/
As a best practice, enable a number of audit devices for your production servers; this way, you have some audit trace even if one of the audit devices becomes unavailable.
You can also use vault audit list -detailed to list enabled audit devices, and get the full path for audit device options.
$ vault audit list -detailed
Path      Type    Description    Replication    Options
----      ----    -----------    -----------    -------
file/     file    n/a            replicated     file_path=/vault/vault-audit.log
Errors encountered when enabling audit devices
You can potentially meet with errors when enabling an audit device. These are the most common errors with associated root causes.
If you try to enable a filesystem based audit device, but do not specify a log file path, Vault emits the following error to the standard error output:
Error enabling audit device: Error making API request.

URL: PUT http://127.0.0.1:8200/v1/sys/audit/file
Code: 400. Errors:

* file_path is required
The following error is also logged to the Vault server log:
[ERROR] secrets.system.system_cadac0ac: enable audit mount failed: path=file/ error=\"file_path is required\""
If you enable a filesystem based audit device, but the vault process user can't access to the log file path, Vault emits the following error to the standard error output:
Error enabling audit device: Error making API request.

URL: PUT http://127.0.0.1:8200/v1/sys/audit/file
Code: 400. Errors:

* sanity check failed; unable to open "/var/log/vault_audit.log" for writing: open /var/log/vault_audit.log: permission denied
The following error is also logged to the Vault server log:
[ERROR] secrets.system.system_dfa50a38: enable audit mount failed: path=file/ error="sanity check failed; unable to open "/var/log/vault_audit.log" for writing: open /var/log/vault_audit.log: permission denied"
If an error occurred with your request or response, Vault includes the error message
in the error field's value.
...
    "response": {
    "data": {
      "error": "hmac-sha256:eec8e9b7b8d9e4720693c077225f01aeae8ef50bb2e196522041400cc76b8e3c"
    }
  },
  "error": "1 error occurred:\n\t* permission denied\n\n"
...
You can find a list of all non-empty and non-null error fields from the
log with jq:
$ jq 'select(.error != null) | select(.error != "") | [.time,.error] | @sh' $AUDIT_LOG_FILE
Be sure to replace $AUDIT_LOG_FILE in the example with the filename of the Vault audit device log you're analyzing.
If this command returns nothing, then there are no errors in the log.
Audit device log exclusions
When troubleshooting with audit device logs, you should be aware that Vault Enterprise version 1.18.0 are capable of excluding data from audit device output. The audit device exclude parameter allows for configuring specific fields which do not appear in audit device output.
If you're troubleshooting Vault Enterprise 1.18.0 or beyond, be sure to check the audit device details to learn if there are exclusions configured for the device. This will help you make sense of any inconsistencies which might exist in the audit device logs you are working with.
These examples show CLI and API versions of the detailed audit list output command with a configured sample exclude as a reference.
$ vault audit list --detailed
Example output:
Path             Type    Description    Replication    Options
----             ----    -----------    -----------    -------
exclude_example/    file    n/a            replicated     file_path=/var/log/vault-audit.log exclude=[
  {
    "fields": [ "/response/data" ]
  }
]
Note that this audit device at the path exclude_example has configuration in Options to exclude the /response/data field from output as revealed by the --detailed flag.
Be sure to check the detailed audit list and also consult exclusion syntax for audit results to understand how the audit device is excluding fields in your case.
Vault server logs
When the Vault server is starting up, it logs the configuration information such as listener ports, logging level, storage type, and Vault version that you are running.
==> Vault server configuration:

                     Cgo: disabled
              Listener 1: tcp (addr: "0.0.0.0:8200", cluster address: "0.0.0.0:8201", max_request_duration: "1m30s", max_request_size: "33554432", tls: "disabled")
               Log Level: debug
                   Mlock: supported: false, enabled: false
                 Storage: file
                 Version: Vault v1.2.3+ent

==> Vault server started! Log data will stream in below:

2019-11-04T17:48:44.226-0800 [WARN]  no `api_addr` value specified in config or in VAULT_API_ADDR; falling back to detection if possible, but this value should be manually set
2019-11-04T17:48:44.230-0800 [DEBUG] storage.cache: creating LRU cache: size=0
2019-11-04T17:48:44.231-0800 [DEBUG] cluster listener addresses synthesized: cluster_addresses=[0.0.0.0:8201]
2019-11-04T17:48:58.965-0800 [DEBUG] core: unseal key supplied
2019-11-04T17:48:58.967-0800 [DEBUG] core: starting cluster listeners
2019-11-04T17:48:58.967-0800 [INFO]  core.cluster-listener: starting listener: listener_address=0.0.0.0:8201
2019-11-04T17:48:58.967-0800 [INFO]  core.cluster-listener: serving cluster requests: cluster_listen_address=[::]:8201
2019-11-04T17:48:58.968-0800 [INFO]  core: post-unseal setup starting
...
Once Vault starts, the rest of the log entries include the time, the
log level (for example, INFO), the log source, and the log message. Even if you can't
fix the error, these logs will be invaluable in troubleshooting.
You can find errors in the log level as ERR in the logs, but you
might find further context in WARN as well as in the other preceding and
surrounding log entries.
Server log level
To specify the Vault server's log level, you can do one of the following:
- Use the
-log-levelCLI command flag - Set in the
VAULT_LOG_LEVELenvironment variable - Specify with
log_levelparameter in the server configuration file
Supported values (in order of detail) are trace, debug, info, warn, and
err. The default log level is info.
Using the CLI command
When starting the Vault server via CLI, pass the
-log-levelflag to specify the log level.$ vault server -config=/etc/vault/config-file.hcl -log-level=debugVAULT_LOG_LEVEL environment variable
Set the log level in an environment variable.
$ export VAULT_LOG_LEVEL=debugServer configuration file
Specify the
log_levelparameter in the server configuration file.storage "consul" { address = "127.0.0.1:8500" path = "vault" } listener "tcp" { address = "127.0.0.1:8200" tls_cert_file = "/path/to/fullchain.pem" tls_key_file = "/path/to/privkey.pem" } telemetry { statsite_address = "127.0.0.1:8125" disable_hostname = true } log_level = "Debug"
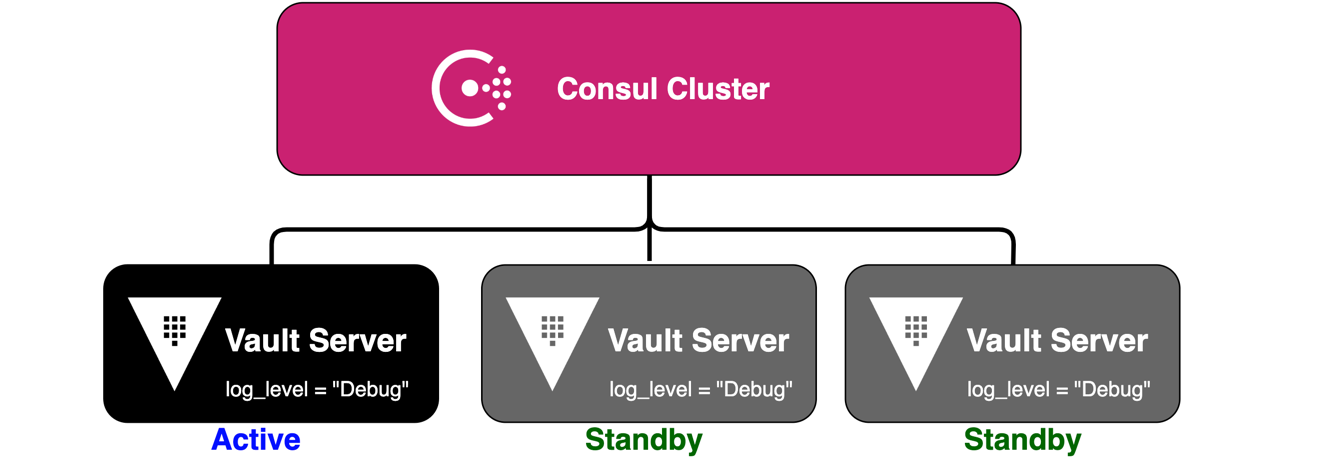
Changing the log level
After you change the log level, you must send a SIGHUP to the
vault process, or restart the Vault server to affect the change.
When you have an HA cluster, apply the change on the standby nodes first,
and then lastly on the active node. By doing this, you ensure that if the
active node fails and one of the standby nodes becomes the new active node,
it has the desired log level.
Finding server logs on Linux systems
On systemd based Linux
distributions, the journald daemon will capture Vault log output
automatically to the system journal. Assuming you named your Vault service vault, use a command like this to retrieve just the Vault-specific log entries
from the journal:
$ journalctl -b --no-pager -u vault
...
Oct 15 17:01:47 ip-10-42-0-27 vault[7954]: 2018-10-15T17:01:47.950Z [DEBUG] replication.index.local: saved checkpoint: num_dirty=0
Oct 15 17:01:52 ip-10-42-0-27 vault[7954]: 2018-10-15T17:01:52.907Z [DEBUG] rollback: attempting rollback: path=auth/token/
Oct 15 17:01:52 ip-10-42-0-27 vault[7954]: 2018-10-15T17:01:52.907Z [DEBUG] rollback: attempting rollback: path=secret/
Oct 15 17:01:52 ip-10-42-0-27 vault[7954]: 2018-10-15T17:01:52.907Z [DEBUG] rollback: attempting rollback: path=sys/
Oct 15 17:01:52 ip-10-42-0-27 vault[7954]: 2018-10-15T17:01:52.907Z [DEBUG] rollback: attempting rollback: path=identity/
Oct 15 17:01:52 ip-10-42-0-27 vault[7954]: 2018-10-15T17:01:52.907Z [DEBUG] rollback: attempting rollback: path=cubbyhole/
Oct 15 17:01:52 ip-10-42-0-27 vault[7954]: 2018-10-15T17:01:52.947Z [DEBUG] replication.index.perf: saved checkpoint: num_dirty=0
Oct 15 17:01:52 ip-10-42-0-27 vault[7954]: 2018-10-15T17:01:52.950Z [DEBUG] replication.index.local: saved checkpoint: num_dirty=0
If your Vault systemd service is not named vault or you're unsure of the
service name, then you can use a more generic command:
$ journalctl -b | awk '$5 ~ "vault"'
The output should go back to the system boot time and will sometimes also
include restarts of Vault. If the output from the above includes log lines
prefixed with vault[NNNN]: , then you've found the server logs.
To package these logs for sharing, you can execute a command such as:
$ journalctl -b --no-pager -u vault | gzip -9 > /tmp/"$(hostname)-$(date +%Y-%m-%dT%H-%M-%SZ)-vault.log.gz"
This will generate a compressed log file in the /tmp directory:
/tmp/ip-10-42-0-27-2018-10-15T17:06:49Z-vault.log.gz
Not finding the server logs?
If you don't find these vault[NNNN]lines in your output, Vault is sending the log output elsewhere. To find it, check the Vault systemd unit, which is typically located at /lib/systemd/system/vault.service or /etc/systemd/system/vault.service.
If you notice something similar to the following:
...
[Service]
...
ExecStart=/bin/sh -c '/home/vagrant/bin/vault server -config=/home/vagrant/vault_nano/config/vault -log-level="trace" > /var/log/vault.log'
...
Then Vault is storing its operational logging in the static file located at /var/log/vault.log.
If Vault is not operating on Linux or is not operating on a systemd based
Linux, another option is writing to the system log via a facility like
logger. In this case, Vault server logs can also be part of the main system logs in these locations:
Docker
Use the docker logs command to get logs from Vault Docker containers:
$ docker logs vault0
Where vault0 is the container name.
To grab all Vault logs from a container and compress them, use a command line like:
$ docker logs vault0 2>&1 | gzip -9 - > vault0.log.gz
Kubernetes
Use the kubectl logs command to get logs from Vault Kubernetes pods:
$ kubectl logs vault-55bcb779b4-8mfn6
Where vault-55bcb779b4-8mfn6 is the pod name.
Troubleshoot storage
Vault offers a number of configurable storage options (for example, Integrated Storage, Consul, MySQL, etc.) and a common root cause of Vault failure can be the storage system.
When Vault encounters an outage, you may need to troubleshoot the storage as well.
Troubleshoot common HTTP API and client errors
Users of the Vault HTTP API or CLI can meet with some errors or warnings, which are straightforward to diagnose and resolve. Here are the most commonly encountered client errors.
Missing client token
Here is an example of this error when attempting to list enabled secrets engines using the HTTP API using the /sys/mounts endpoint, which requires authentication.
$ curl --silent \
       http://127.0.0.1:8200/v1/sys/mounts
{"errors":["missing client token"]}
This error can occur either when using the HTTP API and not passing in a valid "X-Vault-Token" header value. The error also occurs when using the CLI without a cached token that the token helper can read. This cached token is typically in a .vault-token file in the user home directory, and written there by the token helper after a successful authentication with Vault.
The simplest way to resolve the first example is to include a valid "X-Vault-Token" header value in the request. This example does that and also adds the --silent option and pipes the output to jq for a clean and compact listing.
$ curl --header "X-Vault-Token: s.u7NhaeD2zXdWRr7FcaVgsB9v" \
       --silent \
       http://127.0.0.1:8200/v1/sys/mounts \
       | jq -r '.data[].type'
cubbyhole
identity
kv
kv
system
The command now returns the expected results.
With the CLI, the error will appear as in this example.
$ vault secrets list -format=json | jq -r '.[].type'
Error listing secrets engines: Error making API request.

URL: GET http://127.0.0.1:8200/v1/sys/mounts
Code: 400. Errors:

* missing client token
To resolve this issue for the CLI, you need to authenticate against Vault and cache a new token with the token helper.
Here is a simple example using the username and password auth method to get a new Vault token and cache it locally. Use the authentication method you are familiar with to authenticate, instead.
$ vault login -method=userpass username=learner
Password (will be hidden):
Provide the password when prompted, and press return.
Output example:
Success! You are now authenticated. The token information displayed below
is already stored in the token helper. You do NOT need to run "vault login"
again. Future Vault requests will automatically use this token.

Key                    Value
---                    -----
token                  s.XO15l3BxmrNfUqoZfPdPCPgm
token_accessor         twNPN9rjwk9CPCXmsCrZRJUJ
token_duration         768h
token_renewable        true
token_policies         ["default"]
identity_policies      []
policies               ["default"]
token_meta_username    learner
Now, try the command line to list secrets engines again.
$ vault secrets list -format=json | jq -r '.[].type'
cubbyhole
identity
kv
kv
system
The command succeeds because there is now a cached token value again, which you can check like this.
$ cat ~/.vault-token
s.XO15l3BxmrNfUqoZfPdPCPgm%
Server gave HTTP response to HTTPS client
Here is an example of the error when attempting to enable a KV version 2 secrets engine in a new Vault dev mode server.
$ vault secrets enable -version=2 kv
Error enabling: Post "https://127.0.0.1:8200/v1/sys/mounts/kv": http: server gave HTTP response to HTTPS client
You can commonly meet with this issue in non-production environments. This issue occurs because the Vault server is operating without TLS enabled. The Vault CLI always uses a TLS enabled connection to the server (note the "https" protocol in the Post from the error message), so there is a protocol mismatch.
To resolve this issue, export a VAULT_ADDR environment variable that explicitly sets the HTTP protocol instead of HTTPS, like this.
$ export VAULT_ADDR=http://127.0.0.1:8200
Try the command again:
$ vault secrets enable -version=2 kv
Success! Enabled the kv secrets engine at: kv/
Troubleshooting approach
Reproduce the bug
Review the Vault configuration and environment as shown in the Vault server logs. If possible, try to reproduce the error in a clean environment and a new vault storage state. Try reproducing the bug as cleanly as possible; some errors in Vault can be temporary.
Source of the error
Decide if the error is coming from the Vault UI or the API, or if it's from Vault or a third-party service. If the issue is in the UI, check the network inspector to understand the API call and response. This should help you learn it if is an API or a UI error. For example, if Vault uses AWS storage, is is the error coming from the AWS API?
If it's from Vault, check if the parameters in your request appear in the error at all, then check documentation for those parameters. Remember that the audit logs can offer the insight into every request came into Vault.
During the troubleshooting, you may need the raw audit data with no hashing. To
collect the raw data, you can enable an audit device with log_raw=true
parameter.
$ vault audit enable -path=file_raw file \
        file_path=/vault/audit-law.log \
        log_raw=true
Reproduce the error to generate the audit log with raw data.
After collecting the information you need, be sure to turn off raw auditing:
$ vault audit disable file_raw
Vault policies
When you receive the 403 permission denied error, it is necessary to review
the policies. The permission denied errors can often be the result of a policy
path mis-match.
You can use the vault token capabilities command to check allowed operations
against a path.
Example:
Create a token with the policy you want to test.
$ vault token create -policy=webapp

Key                  Value
---                  -----
token                s.IcTMGNOug5Cx3wBqpGvI5X4e
token_accessor       s2FhMCQssibpiGeBzVWhxJmn
token_duration       768h
token_renewable      true
token_policies       ["default" "webapp"]
identity_policies    []
policies             ["default" "webapp"]
Using the token with policy attached, check the capabilities against the path of question.
$ vault token capabilities s.IcTMGNOug5Cx3wBqpGvI5X4e transit/decrypt/phone-number
deny
This example shows that the client token has no permission (deny) against
the transit/decrypt/phone-number path which explains why Vault returned the
permission denied error when the application tried to invoke the endpoint.
Search the Vault GitHub and Google Group
Often, the issue you encountered may be a known issue and perhaps, it got fixed or a workaround exists. Search the Vault GitHub repository and Google Group for your issue to learn more.
Also, you should search the Vault Changelog for your issue. You might find that it got fixed in a later version.
If you are comfortable reading the source code, you can search for a particular error string in the Vault repository.
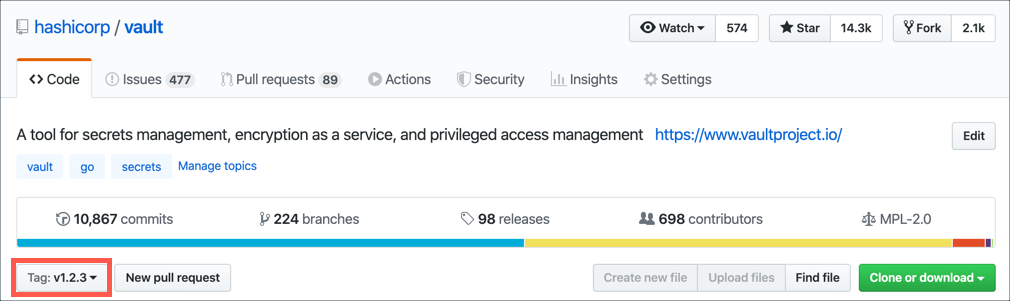
Narrowing down to the particular Vault version branch to match the version that you are running may speed up your search.
Troubleshooting tools
The following are HashiCorp supported tools that you can use to enhance your troubleshooting workflows.
Vault debug tool
You can execute the vault debug
command on a Vault server node for a specific period of time,
recording information about the node, its cluster and its host environment. The
information collected, packaged, and written to the user specified path.
To create a debug package using default duration (2 minutes) and interval (30 seconds) in the current directory capturing all applicable targets, execute the command with no parameter.
$ vault debug
The output name scheme is vault-debug-<time-stamp> which gets written to the
current directory. To specify the output location and the filename different
from the default, use the -output flag.
To create a debug package with 1 minute interval for 10 minutes, execute the following command:
$ vault debug -interval=1m -duration=10m
The generated debug package contents may look similar to the following.
First, extract the file.
$ tar xvfz vault-debug-2019-11-06T01-26-54Z.tar.gz
List the extracted files and folders.
$ tree
.
├── vault-debug-2019-11-06T01-26-54Z
│   ├── 2019-11-06T01-26-54Z
│   │   ├── goroutine.prof
│   │   ├── heap.prof
│   │   ├── profile.prof
│   │   └── trace.out
│   ├── 2019-11-06T01-26-59Z
│   │   ├── goroutine.prof
│   │   ├── heap.prof
│   │   ├── profile.prof
│   │   └── trace.out
...
│   ├── config.json
│   ├── host_info.json
│   ├── index.json
│   ├── metrics.json
│   ├── replication_status.json
│   └── server_status.json
Vault metrics
The debug package lists Vault metrics data (metric.json).
...
{
  "Labels": {},
  "Name": "vault.runtime.alloc_bytes",
  "Value": 7805160
},
{
  "Labels": {},
  "Name": "vault.runtime.free_count",
  "Value": 386623
},
{
  "Labels": {},
  "Name": "vault.runtime.heap_objects",
  "Value": 46342
},
...
To learn more about these metrics, refer to the Vault Telemetry documentation for the unit of measurement and definition.