Monitor enterprise replication
Disaster Recovery Replication Setup, and Performance Replication Setup guides walked through the steps to configure Vault replication.
This tutorial focuses on monitoring and troubleshooting the replication setup.
This tutorial covers the following topics:
- Replication status check
- Port traffic consideration with load balancer
- WAL replays
- Key monitoring metrics
- Vault configuration considerations
- Update replication primary
- Replication bootstrapping issues
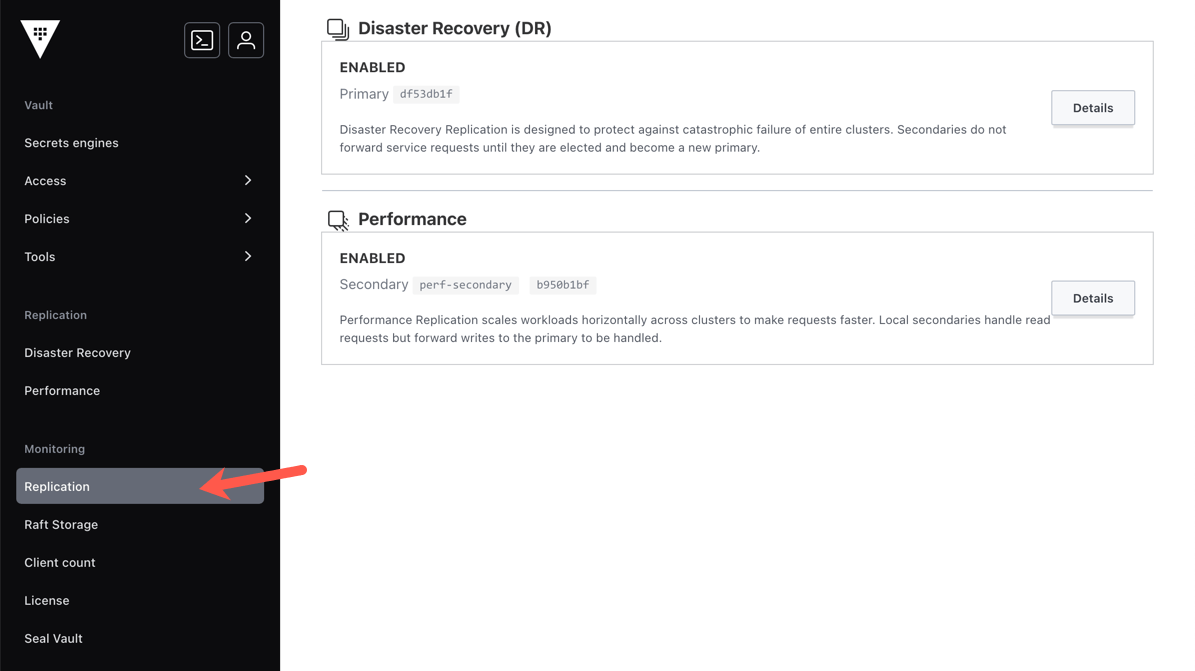
Replication status check
The status endpoint provides information on WAL streaming and the Merkle Tree which are basic elements of Vault's replication system. In short, Vault uses WAL streaming for normal ongoing replication, whereas it uses the merkle tree and syncs for recovery when replication is too far out of sync to use WALs. For more detail on how these work, please review Replication Implementation Details.
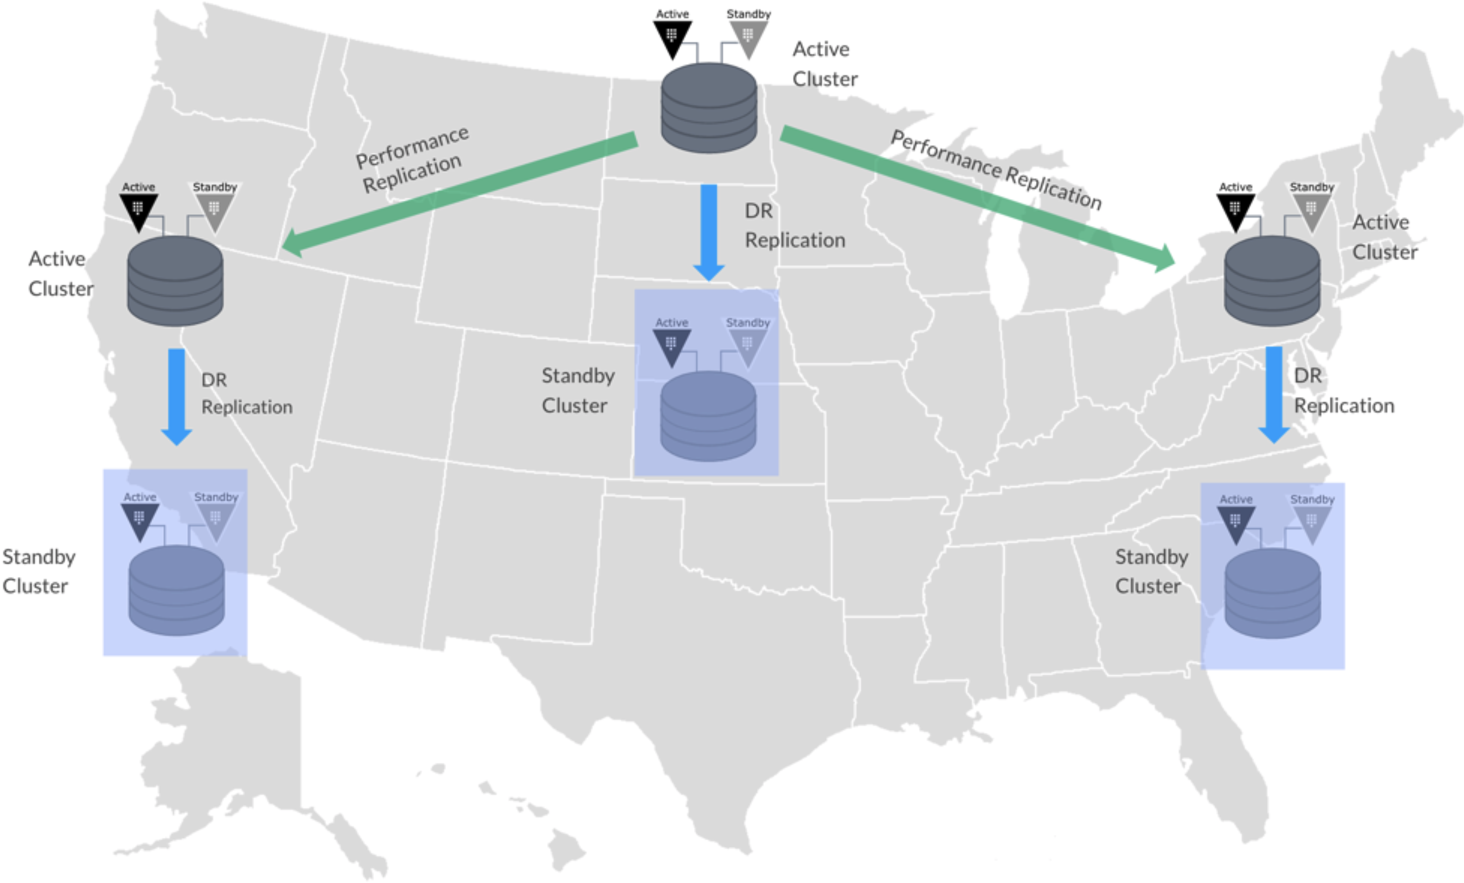
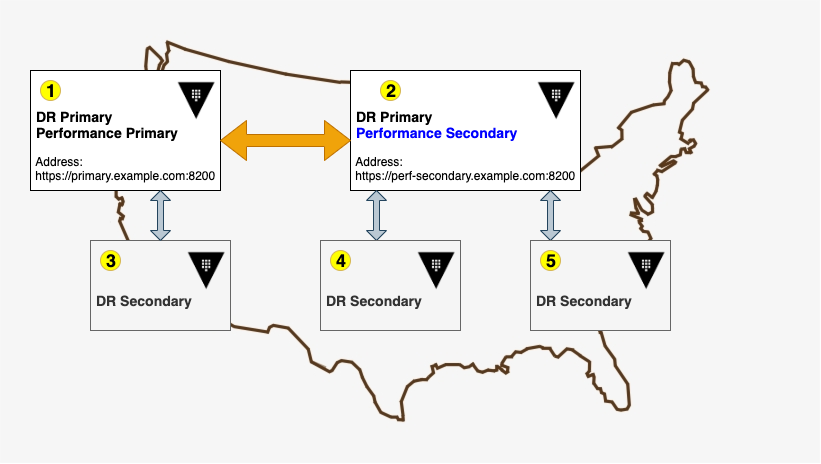
Presume that you have a cluster 1, which you configured to be the performance replication primary, and it has a disaster recovery (DR) site which is cluster 3. The cluster 2 is setup to be the performance replication secondary; it also has two DR secondaries, cluster 4 and cluster 5.
To verify the replication status of those clusters, use the
sys/replication/status endpoint.
$ vault read -format=json sys/replication/status
The output has the status for both types of replication, with performance replication status under "performance" and disaster recovery replication status under "dr".
Note that you can also check the status of a specific replication type by specifying a type in the endpoint path.
These examples check the status of performance replication by using the
/v1/sys/replication/performance/status endpoint.
$ vault read -format=json sys/replication/performance/status
Likewise, you can retrieve the status of disaster replication with by using the
/v1/sys/replication/dr/status endpoint.
$ vault read -format=json sys/replication/dr/status
Parameters to check
On the primary cluster:
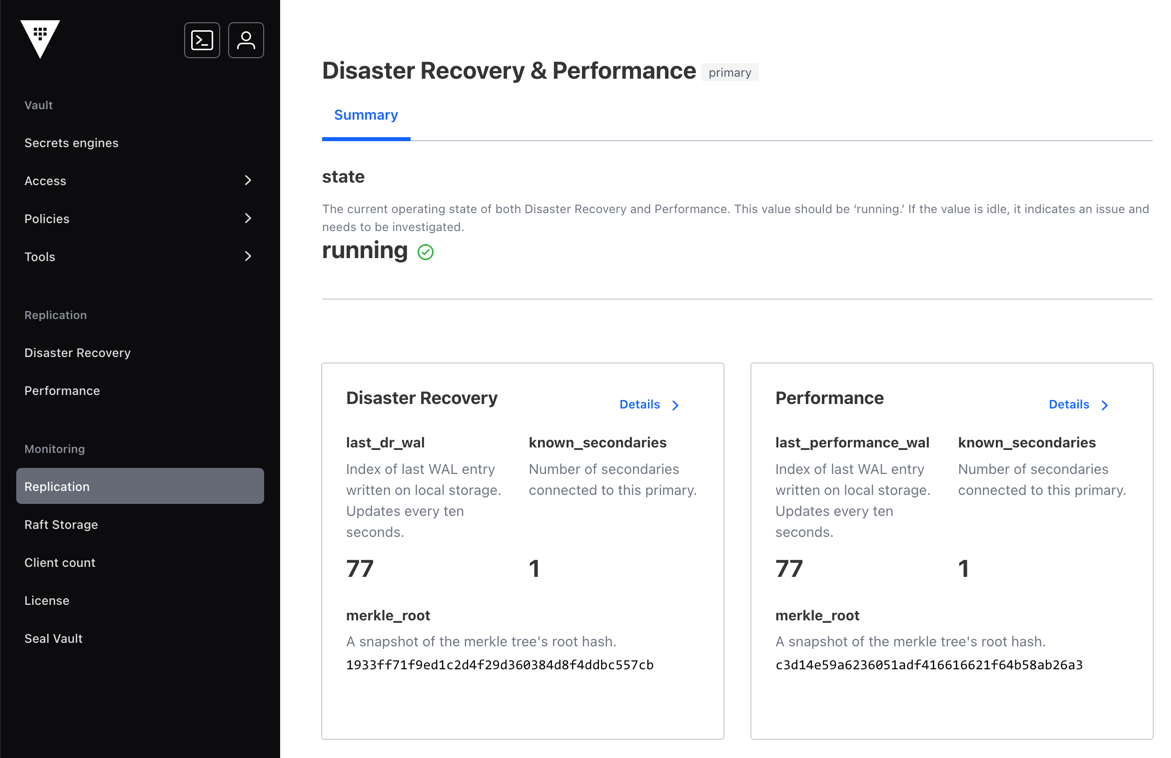
cluster_id: Unique ID for this set of replicas. This value should always match on the Primary and Secondary.known_secondaries: List of the IDs of all non-revoked secondary activation tokens created by this Primary. The ID appears regardless of whether the token activated an actual secondary cluster.last_dr_wal: (Vault version 1.4.0+) Index of the last write-ahead log for disaster recovery. Note that all Vault Enterprise clusters emit this information, regardless of cluster type. (Please review Are my DR Clusters in Sync? for more details.)last_performance_wal: (Vault version 1.4.0+) The last WAL value known to the primary that shipped to the secondary. (Please review Are my Performance Clusters in Sync? for more details.)last_wal: Index of the last Write-Ahead Logs (WAL) entry written on the local storage. Note that Vault creates WALs for every write to storage.merkle_root: A snapshot in time of the merkle tree's root hash. Themerkle_rootchanges on every update to storage.mode: This should be "primary".primary_cluster_addr: If you set aprimary_cluster_addrwhen enabling replication, it will appear here. If you did not explicitly set this, this field will be blank on the primary. As such, a blank field here is not unusual.state: This value should berunningon the primary. If the value isidle, it indicates an issue that needs investigation.
On the secondary cluster:
cluster_id: Unique ID for this set of replicas. This value should always match on the Primary and Secondary.connection_state: The value can beidle,connecting,ready,transientfailure, orshutdownwithreadybeing the healthy state. You can use this parameter to detect connection failures between the secondary and primary cluster.known_primary_cluster_addrs: List of cluster_addr values from each of the servers in the Primary's cluster. This list updates every 5 seconds and the Secondary uses the list to know how to communicate with the Primary in the event of a Primary server's active leader changing.last_remote_wal: The last WAL index that the secondary received from the primary via WAL streaming.merkle_root: A snapshot in time of the merkle tree's root hash. Themerkle_rootchanges on every update to storage.mode: This should be "secondary".primary_cluster_addr: This records the first address that the secondary uses to communicate with the Primary after enabling replication. It may not reflect the current address (please reviewknown_primary_cluster_addrs).secondary_id: The ID of the secondary activation token used to enable replication on this secondary cluster.state:stream-wals: Indicates normal streaming. This is the value you want to observe.merkle-diff: Indicates that the cluster is determining the sync status to learn if it requires a merkle sync in order for the secondary to catch up to the primary.merkle-sync: Indicates that the cluster is syncing. This happens when the secondary is too far behind the primary to use the normal stream-wals state for catching up. This state is blocking.idle: Indicates an issue. You need to investigate.
sync_progress: When the state value is merkle-sync, this value represents the count of resolved conflicting keys.sync_total_keys: When the state value is merkle-sync, this value represents the total number conflicting keys which require resolution before WAL streaming will resume.
Are my DR clusters in sync?
It is straightforward to tell if DR clusters are in sync since they replicate all data.
When the clusters are fully in sync, you can expect to observe:
stateof secondary will bestream-wals- Generally, the
merkle_rooton the primary and secondary will match - Vault versions 1.4.0 and higher: The
last_dr_walfield in the replication status output on the primary represents the last known WAL shipped to the secondary. Compare withlast_remote_walon a secondary to learn how far behind it is from the primary. - Vault versions before 1.4.0:
last_remote_walon the secondary should match (or be close to) thelast_walvalue on the primary.
Are my performance clusters in sync?
Performance replication only replicates a subset of data, so checking to make sure the clusters are in sync is a bit more involved.
Most importantly, the last_wal and last_remote_wal values are NOT always the
same for performance replication. This is because the last_wal on the primary
tracks all its WALs, not just the replicating data. (Remember
not everything gets replicated to the secondary. For example, tokens.)
They should become the same momentarily after you write a replicated piece of
data to the cluster since the last_wal written to the primary should be the
piece of data and the last_remote_wal that the secondary learns via WAL
streaming would be the same WAL.
When the clusters are fully in sync, you can expect to observe:
stateof secondary will bestream-wals- Right after writing a piece of replicated data, the
last_remote_walon the secondary should match thelast_walon the primary for a short period of time. - Generally, the
merkle_rooton the primary and secondary will match. Keep in mind that themerkle_rootchanges at every update.
Important notes about sync
- When you first set up replication, the
last_remote_walon the secondary will be0until you write data on the primary that replicates to the secondary. The reason for this, is the initial data sync when you first enable replication on a secondary happens via Merkle sync rather than via WAL streaming. Therefore, it does not have any remote WALs until after it bootstraps, entersstream-walsmode, and then receives a new piece of replicated data from the primary via WAL streaming. - Be aware that a persistent difference in WAL values between the primary and a secondary can have a range of possible causes, including but not limited to:
- Network issues between primary and secondary
- Resource constrained systems in the primary or secondary
- Problems with specific keys - in this case, the Vault operational logs and storage logs will have details about the problematic key(s)
- In cases where the difference between WALs is extreme or when issues exist with the underlying storage, it can become necessary to perform a reindex operation on the primary. In such cases, the operational logs will contain errors with suggestions to reindex like this example:
[ERROR] replication: encountered error, applying backoff: backoff=2s error="state is still irreconcilable after reindex, try reindexing primary cluster"
Again, here is our scenario:
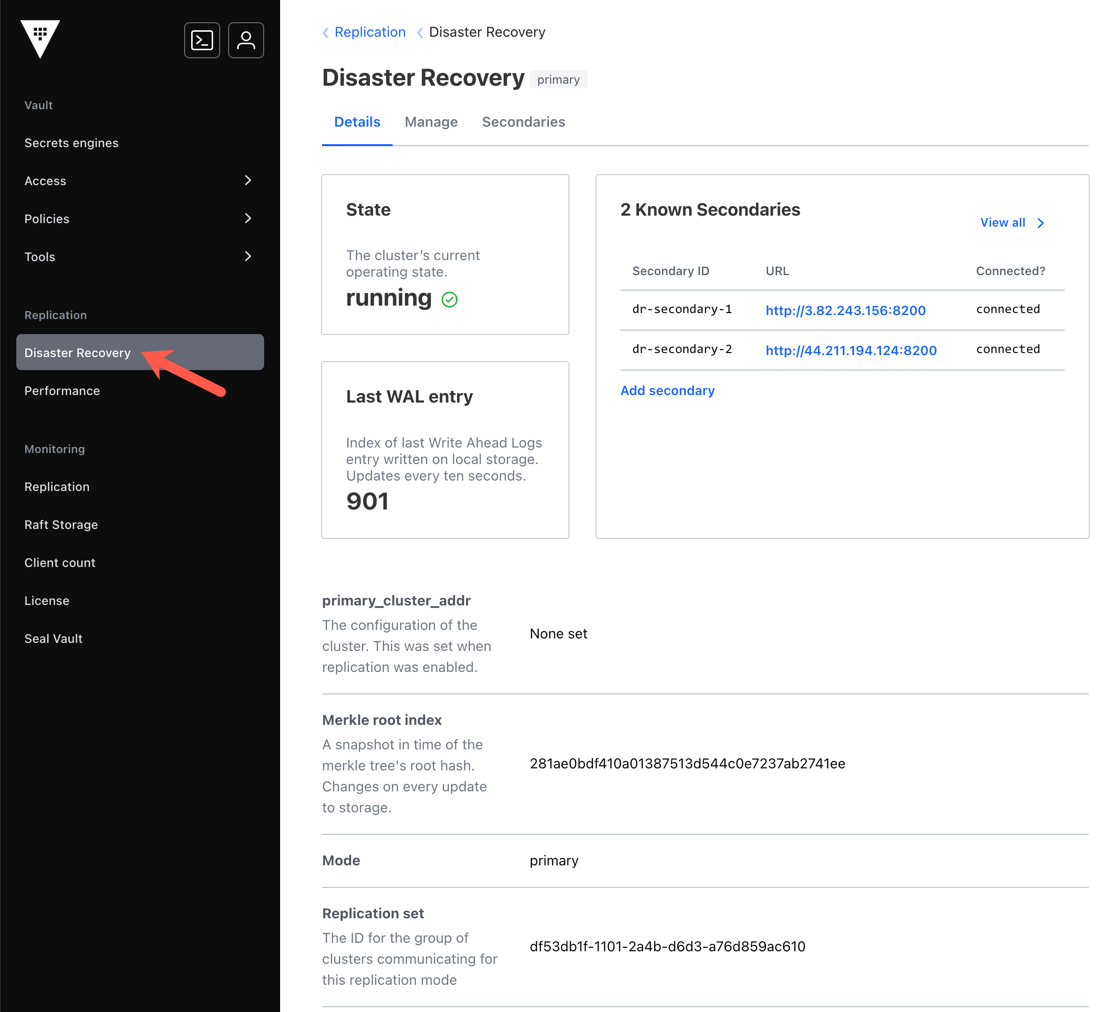
Example - cluster 1
Cluster 1 is both a Performance and DR primary; therefore, the mode for dr
is "primary". The same for performance. The state is "running"
for both dr and performance replication. The Performance and DR outputs for
this one server have separate cluster_ids and merkle_roots since each of these
forms of replication works independently of the other.
$ vault read -format=json sys/replication/status | jq -r ".data"
{
  "dr": {
    "cluster_id": "d62cd840-8429-308a-6ff2-34c57f0c99bf",
    "known_secondaries": [
      "dr-secondary"
    ],
    "last_dr_wal": 119,
    "last_reindex_epoch": "0",
    "last_wal": 119,
    "merkle_root": "ab4cac6991f3f7a4217819ed9153c663610ec694",
    "mode": "primary",
    "primary_cluster_addr": "",
    "secondaries": [
      {
        "api_address": "http://dr-secondary-of-perf-primary.example.com:8200",
        "cluster_address": "https://10.1.1.13:8201",
        "connection_status": "connected",
        "last_heartbeat": "2020-07-16T05:18:39Z",
        "server_id": "dr-secondary"
      }
    ],
    "state": "running"
  },
  "performance": {
    "cluster_id": "4bff765c-9786-7e37-b196-d3a79f11ea7d",
    "known_secondaries": [
      "perf-secondary"
    ],
    "last_performance_wal": 119,
    "last_reindex_epoch": "0",
    "last_wal": 119,
    "merkle_root": "e8e60e66c09f87da30b8e026775519723f5ec332",
    "mode": "primary",
    "primary_cluster_addr": "",
    "secondaries": [
      {
        "api_address": "http://perf-secondary.example.com:8200",
        "cluster_address": "https://10.1.2.219:8201",
        "connection_status": "connected",
        "last_heartbeat": "2020-07-16T05:18:36Z",
        "server_id": "perf-secondary"
      }
    ],
    "state": "running"
  }
}
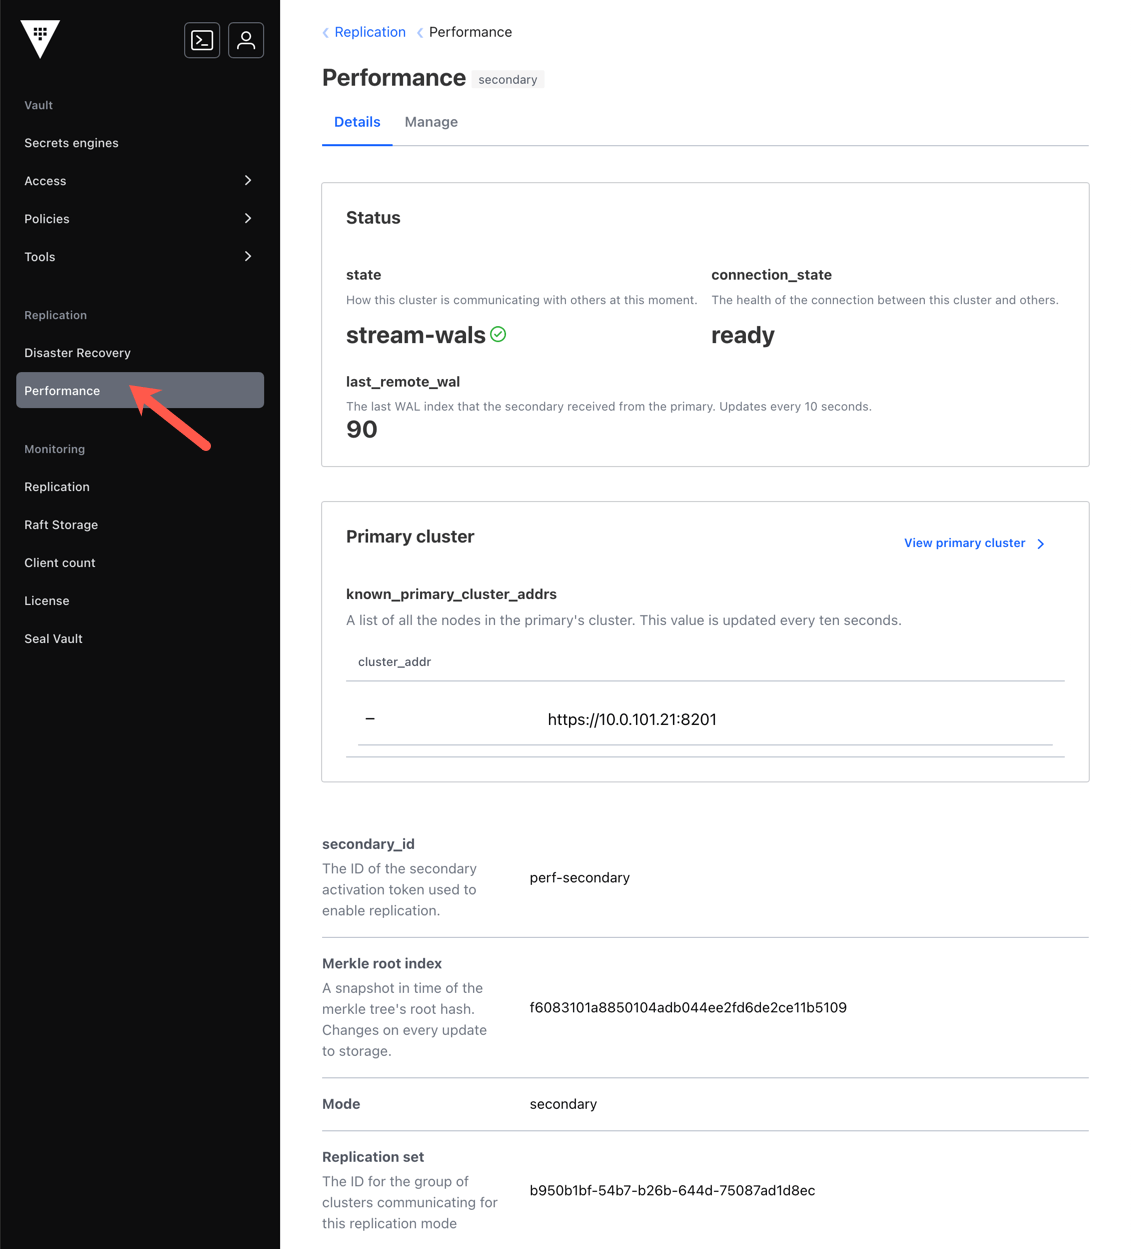
Example - cluster 2
Cluster 2 is a DR primary cluster and a Performance secondary cluster;
therefore, its mode for dr is "primary"; however, for performance
replication, it's set to "secondary". Notice that the secondary displays
last_remote_wal rather than last_wal and its state is stream-wals.
The secondary's merkle_root should generally match the merkle_root of its
primary. If that is off, you can write a test piece of replicated data to the
performance primary and then check to make sure the last_wal on the primary
matches (or almost matches) the last_remote_wal on the secondary right
afterwards.
$ vault read -format=json sys/replication/status | jq -r ".data"
{
  "dr": {
    "cluster_id": "5a0ddeb8-3285-81d4-e5a4-a63f02086130",
    "known_secondaries": [
      "dr-secondary-1",
      "dr-secondary-2"
    ],
    "last_dr_wal": 678,
    "last_reindex_epoch": "0",
    "last_wal": 678,
    "merkle_root": "408fbbc895fb63ae7e0d392d5d34e5b5b5a9f6be",
    "mode": "primary",
    "primary_cluster_addr": "",
    "secondaries": [
      {
        "api_address": "http://dr-secondary-1.example.com:8200",
        "cluster_address": "https://10.1.2.131:8201",
        "connection_status": "connected",
        "last_heartbeat": "2020-07-16T05:40:02Z",
        "server_id": "dr-secondary-1"
      },
      {
        "api_address": "http://dr-secondary-2.example.com:8200",
        "cluster_address": "https://10.1.1.182:8201",
        "connection_status": "connected",
        "last_heartbeat": "2020-07-16T05:40:02Z",
        "server_id": "dr-secondary-2"
      }
    ],
    "state": "running"
  },
  "performance": {
    "cluster_id": "4bff765c-9786-7e37-b196-d3a79f11ea7d",
    "connection_state": "ready",
    "known_primary_cluster_addrs": [
      "https://10.1.1.150:8201"
    ],
    "last_reindex_epoch": "1594876385",
    "last_remote_wal": 375,
    "merkle_root": "5f132ea8db357817f89d7c7a326b1e0d728fcc56",
    "mode": "secondary",
    "primaries": [
      {
        "api_address": "http://perf-primary.example.com:8200",
        "cluster_address": "https://10.1.1.150:8201",
        "connection_status": "connected",
        "last_heartbeat": "2020-07-16T05:40:01Z"
      }
    ],
    "primary_cluster_addr": "https://10.1.1.150:8201",
    "secondary_id": "perf-secondary",
    "state": "stream-wals"
  }
}
Example - cluster 3
Cluster 3 is a DR secondary of cluster 1; therefore, its list of
known_primary_cluster_addrs should include the cluster address of each server in
cluster 1 (or a load balancer that will direct it there).
The DR Secondary must remain synchronized with its DR primary. The last_wal
of primary and last_remote_wal of secondary should be the same (or nearly the
same with a little latency introduced by the network).
$ vault read -format=json sys/replication/status | jq -r ".data"
{
  "dr": {
    "cluster_id": "d62cd840-8429-308a-6ff2-34c57f0c99bf",
    "connection_state": "ready",
    "known_primary_cluster_addrs": [
      "https://10.1.1.150:8201"
    ],
    "last_reindex_epoch": "1594876549",
    "last_remote_wal": 511,
    "merkle_root": "080c01d50875a1d1943451d8a24ef570b2ff41e1",
    "mode": "secondary",
    "primaries": [
      {
        "api_address": "http://perf-primary.example.com:8200",
        "cluster_address": "https://10.1.1.150:8201",
        "connection_status": "connected",
        "last_heartbeat": "2020-07-16T05:51:19Z"
      }
    ],
    "primary_cluster_addr": "https://10.1.1.150:8201",
    "secondary_id": "dr-secondary",
    "state": "stream-wals"
  },
  "performance": {
    "mode": "disabled"
  }
}

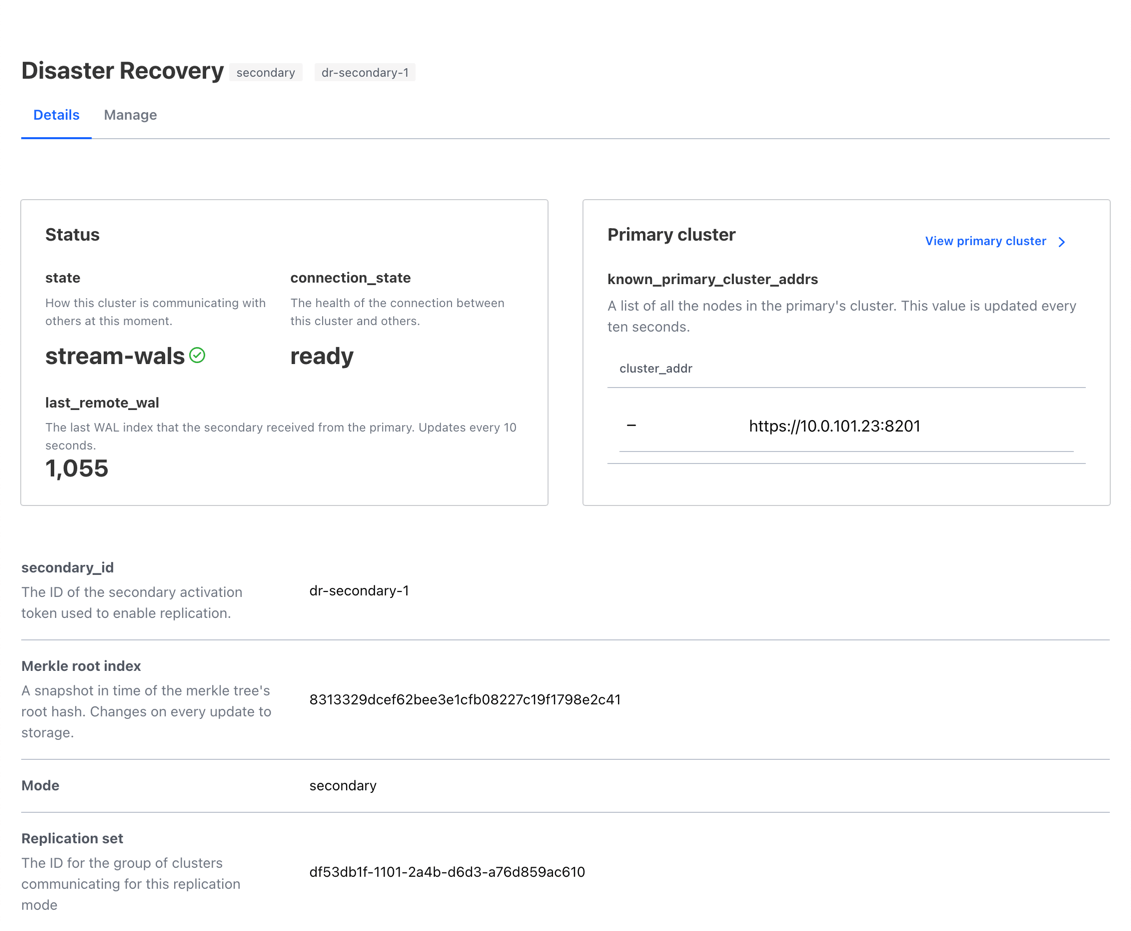
Example - cluster 4
Cluster 4 is a DR secondary of cluster 2; as in the example for cluster 3, the
last_wal of primary and last_remote_wal of secondary should be the same (or
nearly the same with a little latency introduced by the network).
$ vault read -format=json sys/replication/status | jq -r ".data"
{
  "dr": {
    "cluster_id": "5a0ddeb8-3285-81d4-e5a4-a63f02086130",
    "connection_state": "ready",
    "known_primary_cluster_addrs": [
      "https://10.1.2.219:8201"
    ],
    "last_reindex_epoch": "1594876602",
    "last_remote_wal": 993,
    "merkle_root": "3bd45885345947c8f2a12d5b1309e8a62160aa18",
    "mode": "secondary",
    "primaries": [
      {
        "api_address": "http://perf-secondary.example.com:8200",
        "cluster_address": "https://10.1.2.219:8201",
        "connection_status": "connected",
        "last_heartbeat": "2020-07-16T05:53:02Z"
      }
    ],
    "primary_cluster_addr": "https://10.1.2.219:8201",
    "secondary_id": "dr-secondary-1",
    "state": "stream-wals"
  },
  "performance": {
    "mode": "disabled"
  }
}
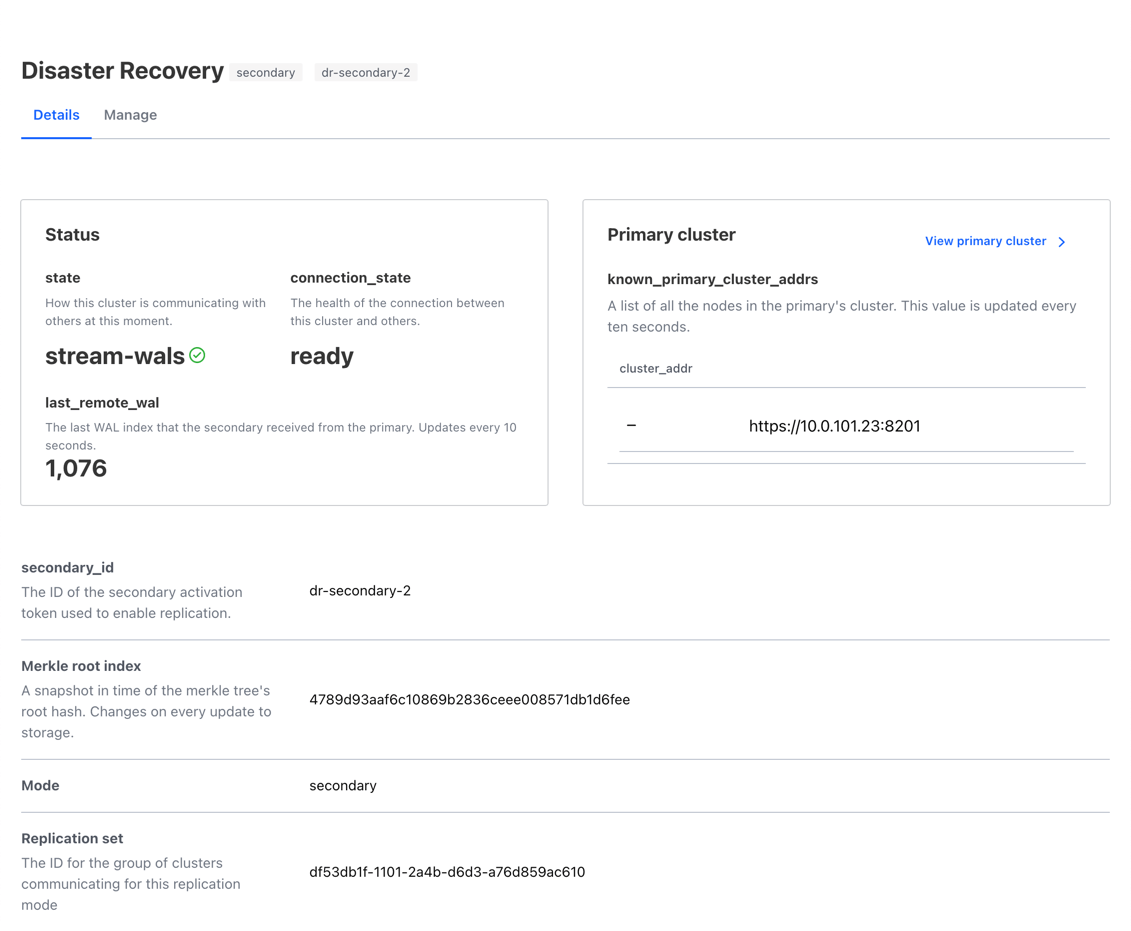
Example - cluster 5
Cluster 5 is another DR secondary of cluster 2; in this contrived example, there was a problem with the cluster 5 host and it is now behind on replication with its primary (cluster 2).
Its merkle-root value does not match the primary and you will notice that it has values for both sync_progress and sync_total_keys indicating that at the time of the status query, 512 of 740 conflicting keys resolved.
Provided that all keys get resolved, this secondary should return to the stream-wals state.
$ vault read -format=json sys/replication/status | jq -r ".data"
{
  "dr": {
    "cluster_id": "559369e0-4897-013a-ed7c-2b817969c643",
    "known_primary_cluster_addrs": [
      "https://perf-secondary.example.com:8201"
    ],
    "last_remote_wal": 180,
    "merkle_root": "8617b6c31d806c7d64079678d5b76e4f763f7512",
    "mode": "secondary",
    "primaries": [
      {
        "api_address": "http://perf-secondary.example.com:8200",
        "cluster_address": "https://10.1.2.219:8201",
        "connection_status": "connected",
        "last_heartbeat": "2020-07-16T05:53:02Z"
      }
    ],
    "primary_cluster_addr": "https://10.1.2.219:8201",
    "secondary_id": "dr-secondary-2",
    "state": "merkle-sync",
    "sync_progress": 512,
    "sync_total_keys": 740,
  },
  "performance": {
    "mode": "disabled"
  }
}
Load balancer traffic considerations
Vault generates its own certificates for cluster members. All replication traffic uses the cluster port using these Vault-generated certificates after initial bootstrapping. Because of this, you can't terminate the cluster traffic at the cluster port on the load balancer level.
If your platform of choice is AWS, use the Classic Load Balancer (ELB) or Network Load Balancer (NLB) rather than Application Load Balancer (ALB). ALB requires termination of the connection and does not support TCP pass through. Therefore, if you are trying to use an ALB for replication traffic, you will run into issues.
If needed, set the
primary_cluster_addr
to override the cluster address value for replication when you enable the
primary.
WAL replays
Write-ahead logs (WALs) replay at startup as well as during a reindex. At startup, the WAL replay is completely blocking of incoming requests (no writes or reads).
During a reindex, the behavior depends on the Vault version:
- Version 0.11.2 and later: Upon a manual reindex trigger via
/sys/replication/reindexendpoint, the very last WAL replay of the reindex will block writes, but allow reads. The rest of the reindex is non-blocking. If a reindex occurs at startup (for example when index records become lost or manually deleted from the underlying storage), the WAL replay blocks the incoming requests (no writes or reads) until the reindex completes. - Version 0.11.1 and earlier: The entire reindex is fully blocking of all operations (no reads or writes).
Reindex
To keep the replicated data consistent across the primary and secondary, Vault
maintains Merkle trees. If replication is in a bad state or something removes data from the storage without Vault's knowledge, you can trigger
reindexing of the Merkle tree via the /sys/replication/reindex endpoint.
Reindex
replication
process can restore the potentially out-of-sync Merkle tree from the underlying
storage so that the tree reflects the correct state of all encrypted secrets.
This is a powerful tool in a situation where unintentional loss of index records occurred.
Key monitoring metrics
This section explains some key metrics to look for that are specific to Vault Replication.
Your Vault configuration must define the telemetry
stanza to
collect the telemetry. For example:
...
telemetry {
  dogstatsd_addr = "localhost:8125"
  disable_hostname = true
}
It is important to collect the Integrated Storage (Raft) telemetry to monitor the overall health of your Vault cluster. Refer to the Telemetry Metrics reference tutorial for more key monitoring metrics to monitor.
| Metric Name | Description |
|---|---|
logshipper.streamWALs.missing_guard | Number of incidences where the starting Merkle Tree index used to begin streaming WAL entries is not matched/found |
logshipper.streamWALs.guard_found | Number of matching or found incidences where the starting Merkle Tree index used to begin streaming WAL entries |
replication.fetchRemoteKeys | Time taken to fetch keys from a remote cluster participating in replication before Merkle Tree based delta generation |
replication.merkleDiff | Time taken to perform a Merkle Tree based delta generation between the clusters participating in replication |
replication.merkleSync | Time taken to perform a Merkle Tree based synchronization using the last delta generated between the clusters participating in replication |
replication.wal.gc | Time taken to complete one run of the WAL garbage collection process |
vault.wal_persistwals | Time taken to persist a WAL to storage |
vault.wal_flushready | Time taken to flush a ready WAL to storage |
wal.gc.total | Total number of WAL on disk |
wal.gc.deleted | Number of WAL deleted during each garbage collection run |
A garbage collector purges the WAL every few seconds, but if Vault is
under heavy load, the WAL may start to grow, putting a lot of pressure on the
storage. To detect back pressure from slow storage,
monitor the vault.wal_flushready and vault.wal_persistwals metrics.
Vault configuration considerations
It's a best practice to explicitly set Vault's HA
parameters
in your Vault configuration file. It is often unnecessary to configure
api_addr and cluster_addr when using Consul as Vault's storage as
Consul tries to automatically discover and advertise the address of the
active Vault servers.
Large Vault deployments typically use a load balancer in front of Vault, and in such cases it is necessary to explicitly set these parameter values.
Example:
listener "tcp" {
  address          = "0.0.0.0:8200"
  cluster_address  = "10.1.42.201:8201"
  tls_cert_file = "/path/to/fullchain.pem"
  tls_key_file  = "/path/to/privkey.pem"
}

storage "consul" {
  address = "127.0.0.1:8500"
  path    = "vault/"
}

telemetry {
  dogstatsd_addr = "localhost:8125"
  disable_hostname = true
}

api_addr = "http://10.1.42.201:8200"
cluster_addr = "https://10.1.42.201:8201"
api_addr: Specifies the full URL to advertise to other Vault servers in the cluster for client redirection.cluster_addr: Specifies the full URL to advertise to other Vault servers in the cluster for request forwarding.
Replication bootstrapping issues
It is possible that you can meet with problematic edge cases while setting up Performance or DR replication clusters. This section introduces common errors seen in actual failures that you could face during the secondary bootstrap step, the root cause of these errors, and how to resolve them.
Error message:
"transport: Error while dialing remote error: tls: internal error"
* error fetching secondary bootstrap package:
error authing for bootstrap:
rpc error: code = Unavailable desc = all SubConns are in TransientFailure,
latest connection error: connection error:
desc = "transport: Error while dialing remote error: tls: internal error"
Possible root cause:
Typically, you observe this error when the primary_cluster_addr value is the address of a load balancer configured to route requests to any member of the primary Vault cluster. This is a common configuration for API communications, as Vault performance standby servers can service read requests (and forward write requests to the active server). The bootstrap process uses RPC to communicate (over a different port) though, and a standby does not forward bootstrap requests to the active server in the primary cluster. This causes the bootstrap to fail with the ambiguous TLS error message shown in the example.
Resolution:
Enable the HA cluster's ability to service read requests from all servers by deploying a separate load balancer for cross-cluster RPC communications that forwards requests to the active cluster server. Configuring the load balancer health check to access the Vault API /sys/health endpoint, and considering a 200 response code as "healthy" helps to achieve this. Review the API documentation for more details.
Once you establish a separate load balancer for the cluster communications, you can specify it for use with the primary_cluster_addr parameter when enabling replication on the primary with the /sys/replication/dr/primary/enable endpoint.
Error message:
"transport: Error while dialing remote error: tls: handshake failure"
* error fetching secondary bootstrap package:
error authing for bootstrap:
rpc error: code = Unavailable desc = connection error:
desc = "transport: Error while dialing remote error: tls: handshake failure"
Possible root cause:
This error message indicates that the RPC communication between this secondary cluster and the primary cluster is failing when initiating an mTLS connection. The server logs should have more details. This error is typically the result of one of the following conditions:
Improper forwarding by a load balancer of the cluster port (8201 by default) to the API port (8200 by default), resulting in a protocol mismatch (HTTPS vs RPC) and TLS failure.
An application-level load balancer (as opposed to a network-level load balancer) that attempts to use HTTPS instead of the RPC protocol, resulting in a protocol mismatch and TLS failure.
The load balancer attempting to offer its own certificate (as with TLS termination) on the RPC port, which will conflict with the internal self-signed certificates generated by Vault for cluster communications.
Resolution:
Ensure that the load balancers used for cross-cluster communication are:
Forwarding the RPC connections to the correct ports to the Vault server listening for RPC communications.
Operating at the network level (and not application level) to prevent protocol mismatch.
Not offering up their own certificates for RPC communications between the clusters.
Update replication primary
Consider a scenario where the performance primary (cluster 1) has two performance secondaries (clusters 2 and 5).
When an unexpected event causes cluster 1 to become inoperative, you would need its DR secondary (cluster 3) to be promoted to be DR primary.
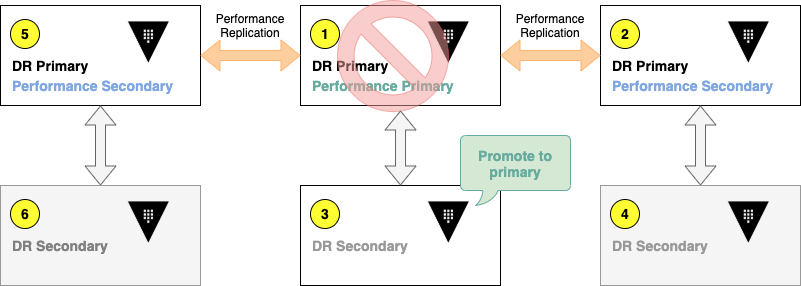
After you promote cluster 3, the performance secondaries point to cluster 3 as its performance primary. You can verify the replication status.
Hints & tips
When you update the replication primary:
Use the
primary_api_addrparameter to specify the primary's API address if you receivederror unwrapping secondary tokenerror from theupdate-primaryoperation.Ensure that your
token(activation token) hasn't expired. If the token expired, you would receiveBad Requesterror.
Some other scenarios where you may need to use the update-primary endpoint are:
- If you have network issues between the Primary's active and standby servers,
the secondary may have an incomplete list of
known_primary_cluster_addrs. If this list of known addresses is incomplete at the time of a Primary leadership change and it does not include the new Primary's active server address, your secondary will start encountering errors indicating a connection refused issue. In this scenario, you will need to useupdate-primaryto inform the secondary of its new primary. If you run into this situation, it's important to also investigate the network problems on the Primary to make sure that it's able to collect cluster information from standby servers to give to the secondary.