Monitor telemetry metrics and audit devices
Challenge
It is important to gain operational and usage insight into a running Vault cluster for the purposes of understanding business use case performance and assisting with proactive incident response.
- Operators and security practitioners need to be aware of conditions that point to potential performance implications on production users, or security issues which require immediate attention.
- Business users concerned with charges or billing must be aware of specific usage metrics and resource counts like dynamic secrets or their leases.
Solution
Vault provides observability data in the form of telemetry metrics that track operational health and performance that you can use with popular solutions for monitoring and alerting on key operational conditions. In addition to telemetry metrics, you can enable audit devices for logging and compliance tracking for logging each client request and response.
You can use Vault telemetry metrics and audit device entries with aggregation agents that send data to an analysis and monitoring solution. This solution provides necessary insight into Vault operations and usage, while also alerting you to issues.
Monitoring is a critical component of the Vault operational excellence workflow. After deploying Vault, establishing observability helps you maintain operational health, troubleshoot issues, and optimize performance based on real usage patterns.
In the following sections, you'll learn more about important metrics to watch, along with action steps for responding to anomalies with specific metrics.
Table of contents:
Monitoring approaches
You can use the following 3 approaches to monitor Vault application health.
- Time-series telemetry data involves capturing metrics from the application, storing them in a special database or index, and analyzing trends in the data over time. Examples include: Splunk, Grafana, CloudWatch, Datadog, and Circonus.
- Log analytics relates to capturing log streams from the system and the application, extracting useful signals from the data, and then further analyzing the results. Examples include: Splunk, Elasticsearch, and SumoLogic.
- Active health checks use active methods of connecting to the application and interacting with it to ensure it is properly responding. Examples include: Consul, Nagios, Sensu, and Keynote.
Time-series monitoring, log analytics, and active health checks can help form a comprehensive monitoring solution, but the focus here is on time-series telemetry metrics along with audit device log entries and system metrics.
Available time-series monitoring solutions
Vault exports telemetry using the go-metrics package with the following agent solutions as sinks:
Once metrics reach an agent, they typically get forwarded to a storage solution for analysis. The following sections detail some popular tools for this piece of the monitoring stack.
Graphite and Grafana
Graphite is an open-source tool for storing and graphing time-series data. It does not support dashboards or alerts, but you can use Grafana in conjunction with Graphite to enable those features.
Telegraf, InfluxDB, Chronograf & Kapacitor
Telegraf, InfluxDB, Chronograf, and Kapacitor- a monitoring solution that is commonly known as the TICK stack. Together, these tools form a full stack solution for storing, displaying, and alerting on time-series data.
The TICK stack is available in both open-source and commercial versions from InfluxData.
- Telegraf provides a statsd-compatible host agent.
- InfluxDB is the time-series database.
- Chronograf is a dashboard engine similar to Grafana.
- Kapacitor provides alerting
Prometheus
Prometheus is a contemporary alternative to statsd-compatible daemons, using lightweight HTTP servers called "exporters" which are then scraped by a Prometheus server. Prometheus is increasingly popular in the containerized world.
Rather than the UDP-based push mechanism used by statsd, Prometheus relies on lightweight HTTP servers called "exporters" which collect the metrics that are then scraped by a Prometheus server.
Datadog
Datadog is a commercial software as a service solution. They offer a customized statsd agent DogStatsd, that includes several vendor-specific extensions such as tagging and service check results.
If you use Datadog, you would use their DogStatsd instead of a tool like Telegraf.
Fluent Bit and Splunk
There is a range of commercial and open-source choices, but configuring those solutions is beyond the scope of what you will learn here.
Instead, you will learn from an example monitoring solution based on Fluent Bit and Splunk. The following sections show complete steps for configuration, and example dashboards to get you started.
Vault Enterprise users can go further with access to a Splunk app that features a variety of predefined dashboards.
Before configuring the monitoring stack, familiarize yourself with the following section, which presents important operational and usage metrics from both Vault and Consul.
Understanding metrics and audit device data
If you're new to Vault telemetry metrics, you can learn about critical telemetry metrics in the following section. The metrics reference information is also good for reference if you are already using a monitoring stack and would like to identify critical metrics.
CPU metrics
These metrics represent system CPU measurements collected by the Fluent Bit agent's CPU log based metrics input. A similar system metrics aggregator can collect metrics like these, but the naming convention can vary. Check with your solution's documentation to confirm metric names and values.
cpu_p
| Metric source | Description |
|---|---|
| Fluent Bit | This metric represents the percentage of CPU used by the overall system including kernel and user space with consideration for the number of CPU cores. |
user_p
| Metric source | Description |
|---|---|
| Fluent Bit | This metric represents the percentage of CPU time spent by user space applications like Vault. |
Why it is important:
Encryption can place a heavy demand on the CPU. If the CPU is too busy, Vault may have trouble keeping up with the incoming request load. You may also want to watch each individual CPU core to make sure requests are evenly balanced across all CPUs.
You can use cpuN.p_cpu, cpuN.p_user, and cpuN.p_system to do so with Fluent Bit. Review the Fluent Bit documentation for more details.
What to look for:
Sudden large changes in CPU percentage over 90% or persistent high usage on specific CPU cores.
Network metrics
These metrics represent system network measurements provided by the Fluent Bit agent's network I/O log based metrics input.
interface_name.rx.bytes
| Metric source | Description |
|---|---|
| Fluent Bit | This metric represents the bytes received on the named network interface. |
interface_name.tx.bytes
| Metric source | Description |
|---|---|
| Fluent Bit | This metric represents the bytes transmitted on the named network interface. |
Why it is important:
A sudden spike in network traffic to Vault might be the result of an anomalous client causing too excessive requests, or extra load you did not plan for.
What to look for:
Sudden large changes to the net metrics (greater than 50% deviation from baseline).
Memory usage
These metrics represent both system level memory measurements provided by the Fluent Bit agent, and Vault specific memory measurements provided as part of the Vault runtime.
mem.total
| Metric source | Description |
|---|---|
| Fluent Bit | This metric represents the total amount of physical memory (RAM) available on the server, measured in bytes. |
mem.used
| Metric source | Description |
|---|---|
| Fluent Bit | This metric represents the amount of physical memory actively in use, measured in bytes. |
mem.free
| Metric source | Description |
|---|---|
| Fluent Bit | This metric represents the amount of physical memory available for use, measured in bytes. |
Vault telemetry metrics
Refer to the critical Vault metrics in the telemetry reference for detailed notes on the critical metrics for monitoring Vault itself, including those for Enterprise Replication and Vault Agent.
File descriptor metrics
These metrics represent system level file descriptor measurements provided by the Fluent Bit agent's Process Log Based Metrics input.
fd
| Metric source | Description |
|---|---|
| Fluent Bit | This metric represents the number of file handles used by all processes on the host or by a specified process as provided by the Fluent Bit agent. |
Why it is important:
Most Vault operations which interact with systems outside of Vault require a file descriptor handle. For example, receiving a connection from another host, sending data between hosts, or writing to disk in the case of Integrated Storage.
If either Vault or Consul (in the case of Vault using Consul storage) runs out of handles, it will stop accepting connections.
What to look for:
When file-nr exceeds 80% of file-max, you should alert operators to take proactive measures for reducing load and at least temporarily increasing user limits.
Vault audit device entries
The following are details about the audit device log data and how you can effectively search them in Splunk.
Get to know the key fields accessible from audit device log data:
type: The type of an audit entry, either "request" or "response". For a successful request, there will always be two events. The audit log event of type "response" will include the "request" structure, and will have all the same data as a request entry. For successful requests you can do all your searching on the events with type "response".
request.path: The path of an API request (request|response).mount_type: The type of the mount that handles this request or response.
request.operation: The operation performed (eg read, create, delete...) auth: The authentication information for the caller:
- .entity_id: If authenticated using an auth method, the entity-id of the user/service.
- .role_name: Depending on auth method, the role name of the user/service.
error: Populated (non-empty) if the response was an error, this field holds the error message.
response.data: In the case of a successful response, the response has a data field corresponding to the response returned to the caller. Vault masks most fields with HMAC when they can contain sensitive values.
Practical example


You can use the information here to build an example monitoring stack based on Fluent Bit and Splunk. It demonstrates a complete example solution to help you get started, and inform your own monitoring solution.
Splunk is a popular choice for searching, monitoring, and analyzing application generated data. Fluent Bit is typically installed on the Vault servers, and helps with sending system metrics, telemetry metrics and audit device log entries to Splunk.
This results in a comprehensive solution for insights into a running Vault cluster.
Vault Enterprise users can also use the Vault Splunk application that bundles popular metrics dashboards for operators, security practitioners, and users concerned with metering usage.
While this example shared as a convenience, the information is also a helpful resource for learning about monitoring and alerting on the important data Vault provides to users and operators.
Notes and prerequisites
You must install and configure the following software in a Linux or macOS environment to follow along with the practical example. The examples work with Ubuntu Linux 24.04 in the interactive sandbox environment.
- Vault - You can use either the Community Edition or Enterprise editions.
- Splunk - This example uses the Splunk Enterprise trial version, but the Splunk Cloud or free version will also work. Be aware that the free version ingests up to 500MB of data per day as a limitation.
- Fluent Bit captures and forward Vault telemetry metrics and system level metrics, along with events from an enabled audit device log.
This tutorial offers configuration instructions based on standard installations of the software for Linux using a combination of command line tools configuration file edits, and web user interfaces.
You should be comfortable operating and configuring Vault to follow along with this example. This example presumes that you can install and configure Fluent Bit and Splunk, and then update an existing Vault configuration to add telemetry functionality.
The versions of software used in this example are as follows:
- Vault v1.19.0
- Fluent Bit v4.0.0
- Splunk Enterprise v9.4
Interactive sandbox
If you'd like to check out using Vault, Fluent Bit, and Splunk together in a fully pre-configured and hands-on environment, give the monitor telemetry and audit devices sandbox a try.
It uses the same set of technologies and workflow in a Docker environment.
Notes about the metrics path
In the data path used for this practical example, Vault exports telemetry metrics ingested by Fluent Bit. Metrics pushed from Fluent Bit to Splunk take on a slightly different format than the source metric types as defined in go-metrics, which Vault uses for its Telemetry.
For more technical details, you can consult the Fluent Bit statsd plugin documentation.
Where possible, all examples here include the available metric type definitions that can you can use.
Configure Splunk
There are two major areas of Splunk configuration required to collect and search the audit device log data from Fluentd and the telemetry metrics data from Telegraf.
Audit device data configuration
- An Events Index is an index type optimized for storage and retrieval of metric data.
- An HTTP Event Collector (HEC) and its associated access token lets you securely send audit device logs to Splunk over the HTTP and Secure HTTP (HTTPS) protocols. In the example used in this tutorial, you configure Fluent Bit to send these data to Splunk.
Telemetry metrics configuration
- A Metrics Index is an index type optimized for storage and retrieval of metric data.
- An HTTP Event Collector and its associated access token lets you securely send metrics to Splunk over the HTTP and Secure HTTP (HTTPS) protocols. In this example, you configure Fluent Bit to send these data to Splunk.
You also need to switch off SSL on the HEC, and add the Vault indexes to the Splunk admin role.
You can configure Splunk with Splunk Web, the splunk CLI, or HTTP API. The configuration process detailed here is just for Splunk Web or the splunk CLI.
Use a browser to open the Splunk Web interface at http://localhost:8000.
Sign in with the username and password of your admin user.
Configure Splunk to receive and index both Vault audit device log and telemetry metrics data into their corresponding HECs and index types.
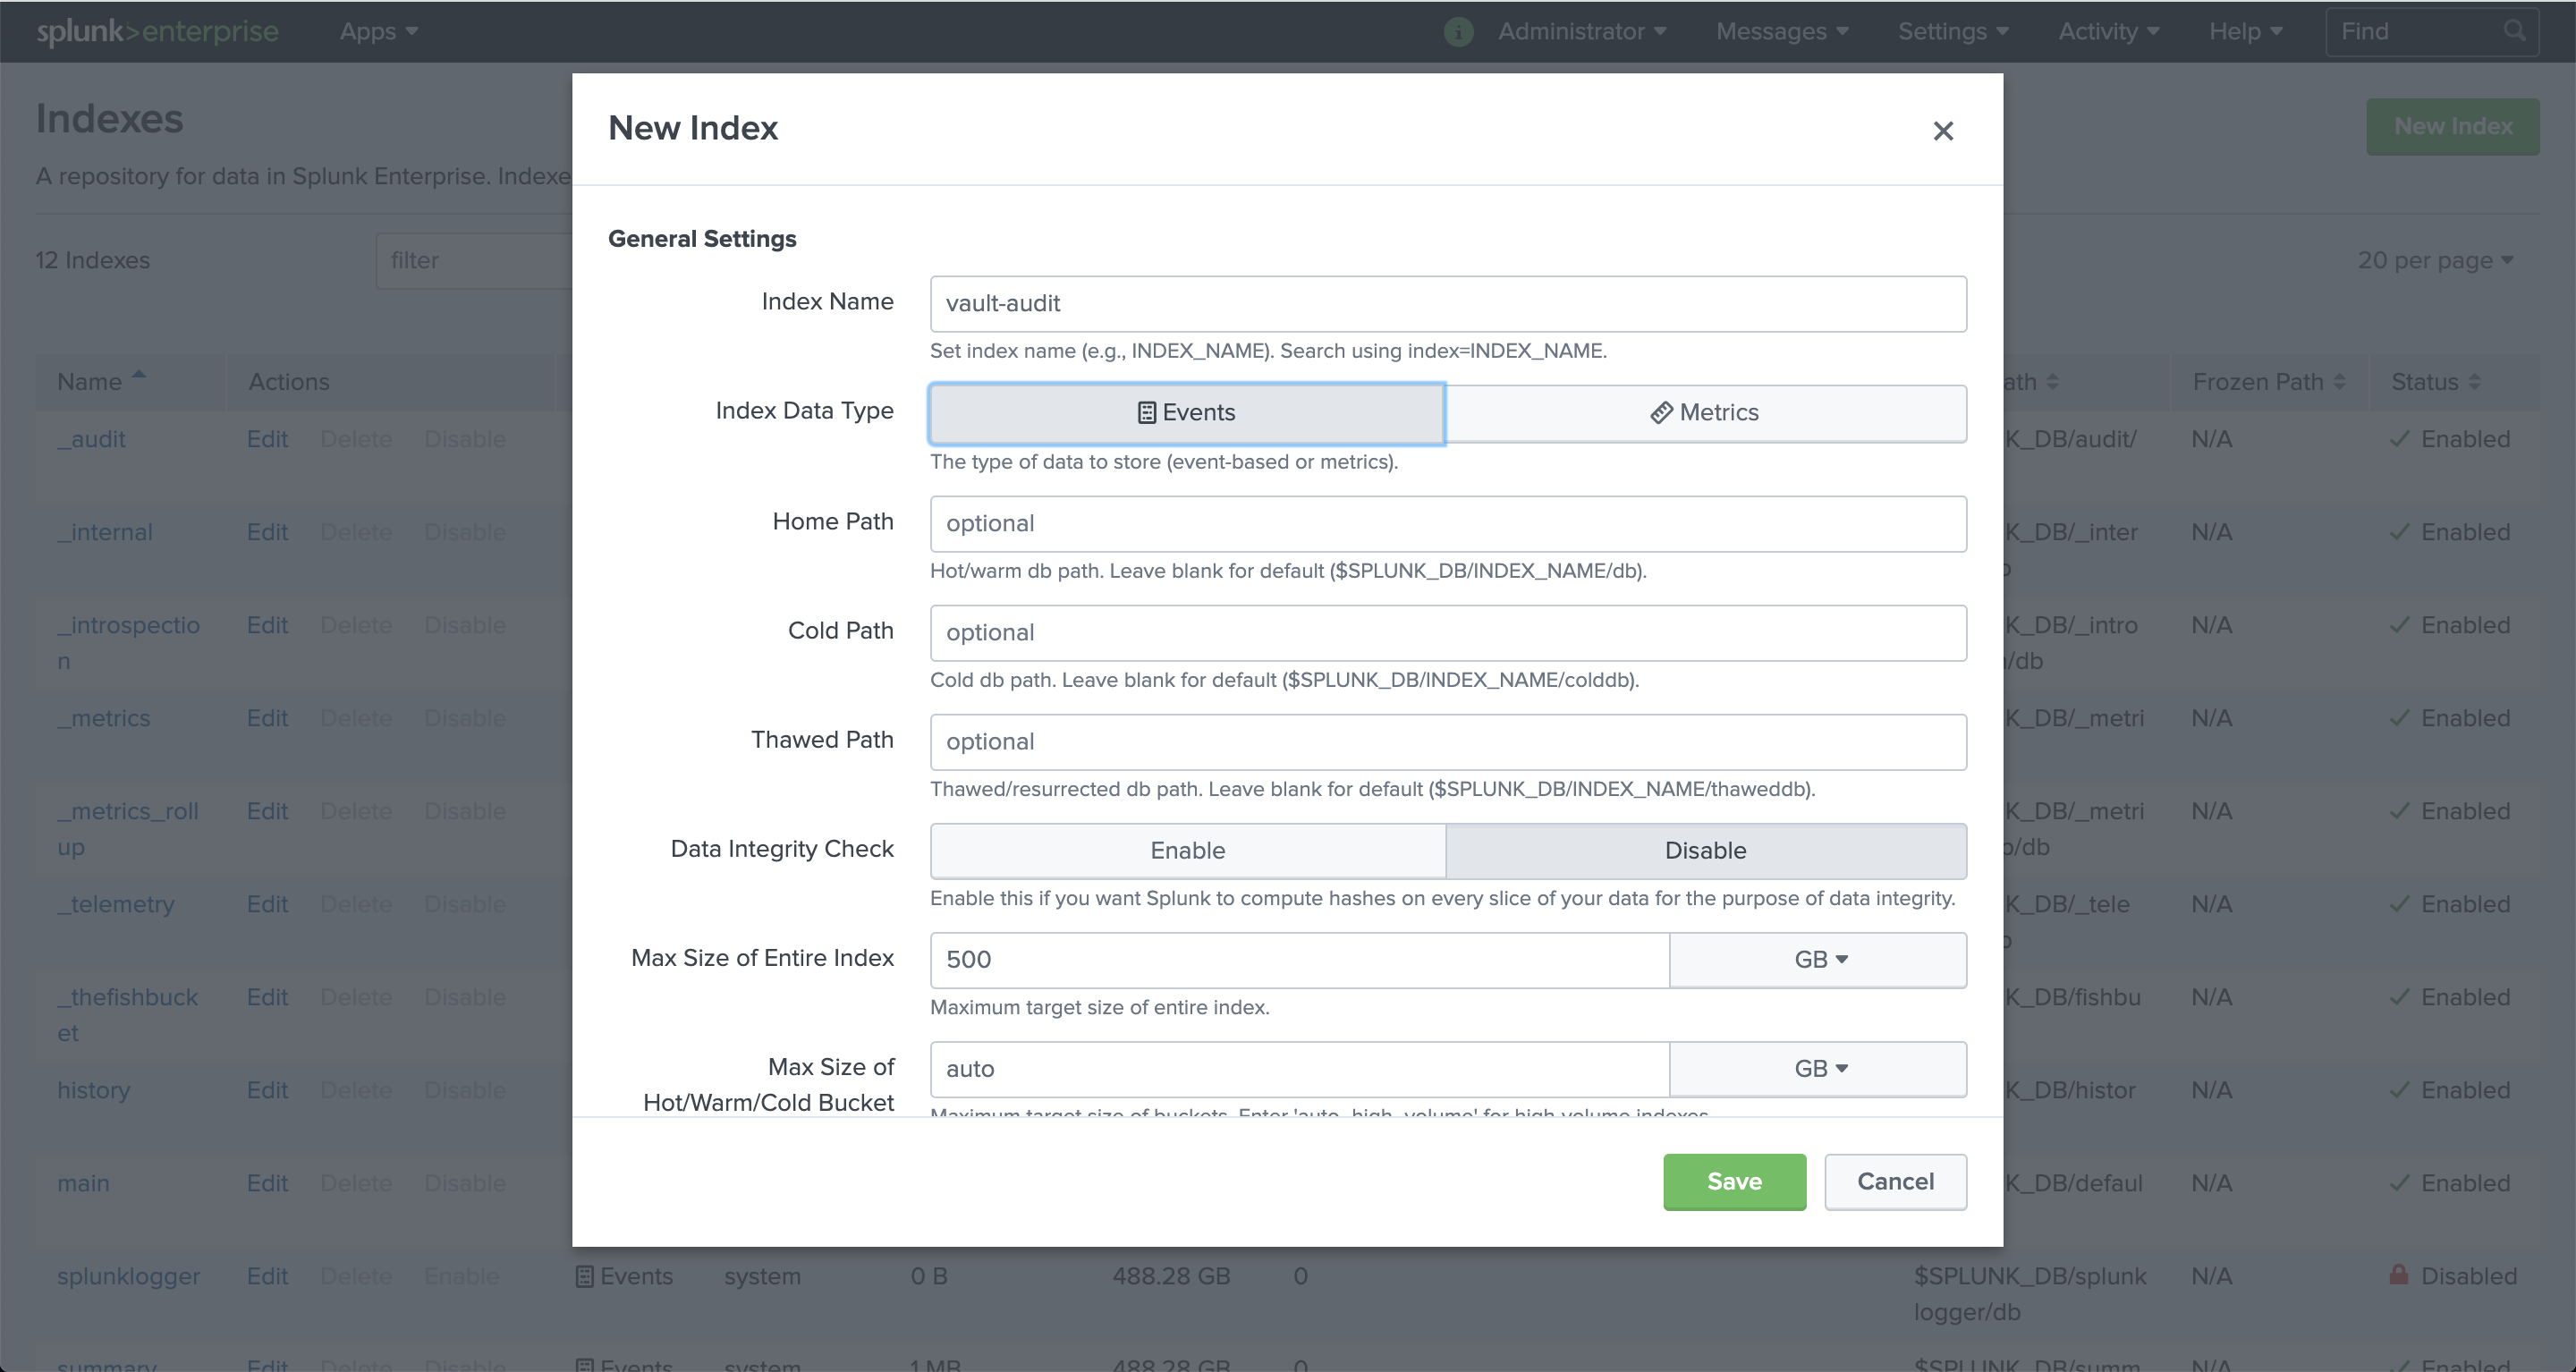
Add events index
Add the events index to contain the audit device log data.
- From the Splunk Web navigation menu, select Settings.
- From under the Data menu, select Indexes.
- Click New Index, and you will notice a dialog like the example shown here.
- For Index Name, enter
vault-audit. - For Index Data Type, select Events.
- Leave all other options at their default values.
- Click Save.
More information about creating events indexes is available in the Splunk documentation for creating Events indexes.
After creating the events index, you can proceed to creating a metrics index.
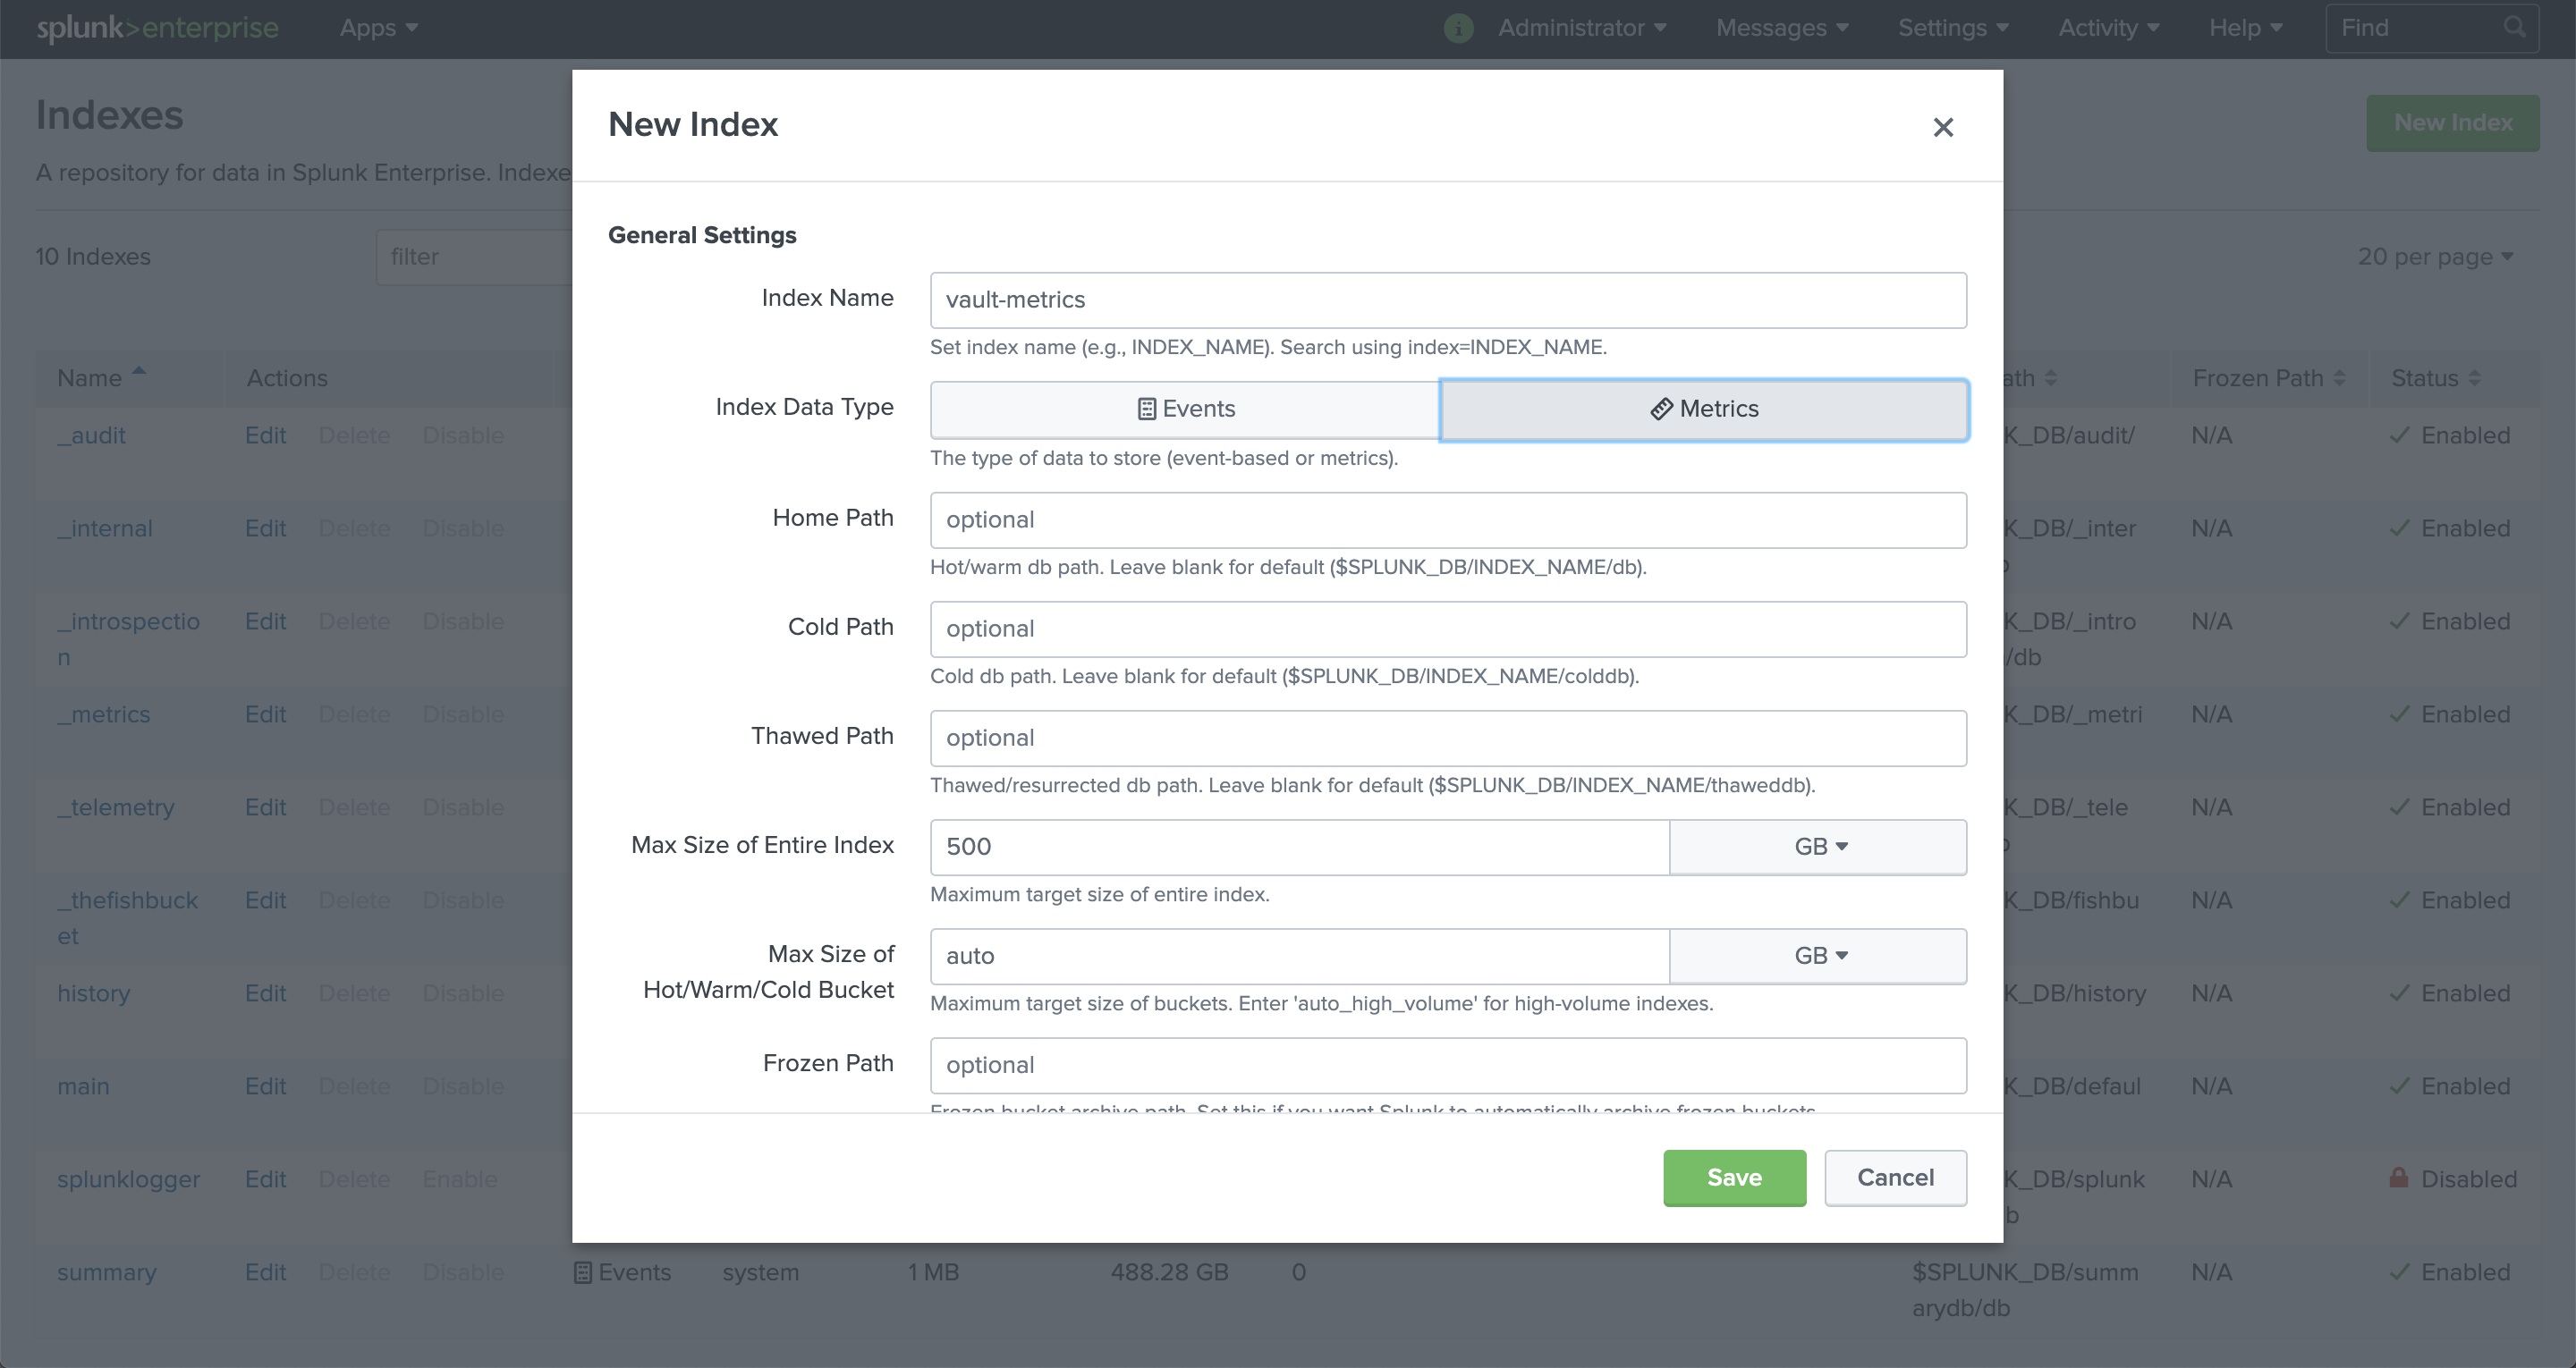
Add metrics index
Add the metrics index to contain the telemetry metrics from Telegraf and Vault.
- From the Splunk Web navigation menu, select Settings.
- From under the Data menu, select Indexes.
- Click New Index and you will notice a dialog like the example shown here.
- For Index Name, enter
vault-metrics. - For Index Data Type, select Metrics.
- Leave all other options at their default values.
- Click Save
More information about creating metrics indexes is available in the Splunk documentation for creating metrics indexes.
After creating the indexes, you can create the HECs that receive Vault audit device and telemetry metrics from Fluent Bit.
Add HEC for Vault audit device
Add the HEC for Vault audit device logs and save the token for later use with the Fluent Bit configuration.

- From the Splunk Web navigation menu, select Settings.
- From under the Data menu, select Data inputs.
- Under the Local inputs section, click Add new beside HTTP Event Collector.
Follow this stepwise process to configure the HEC as shown in the examples.
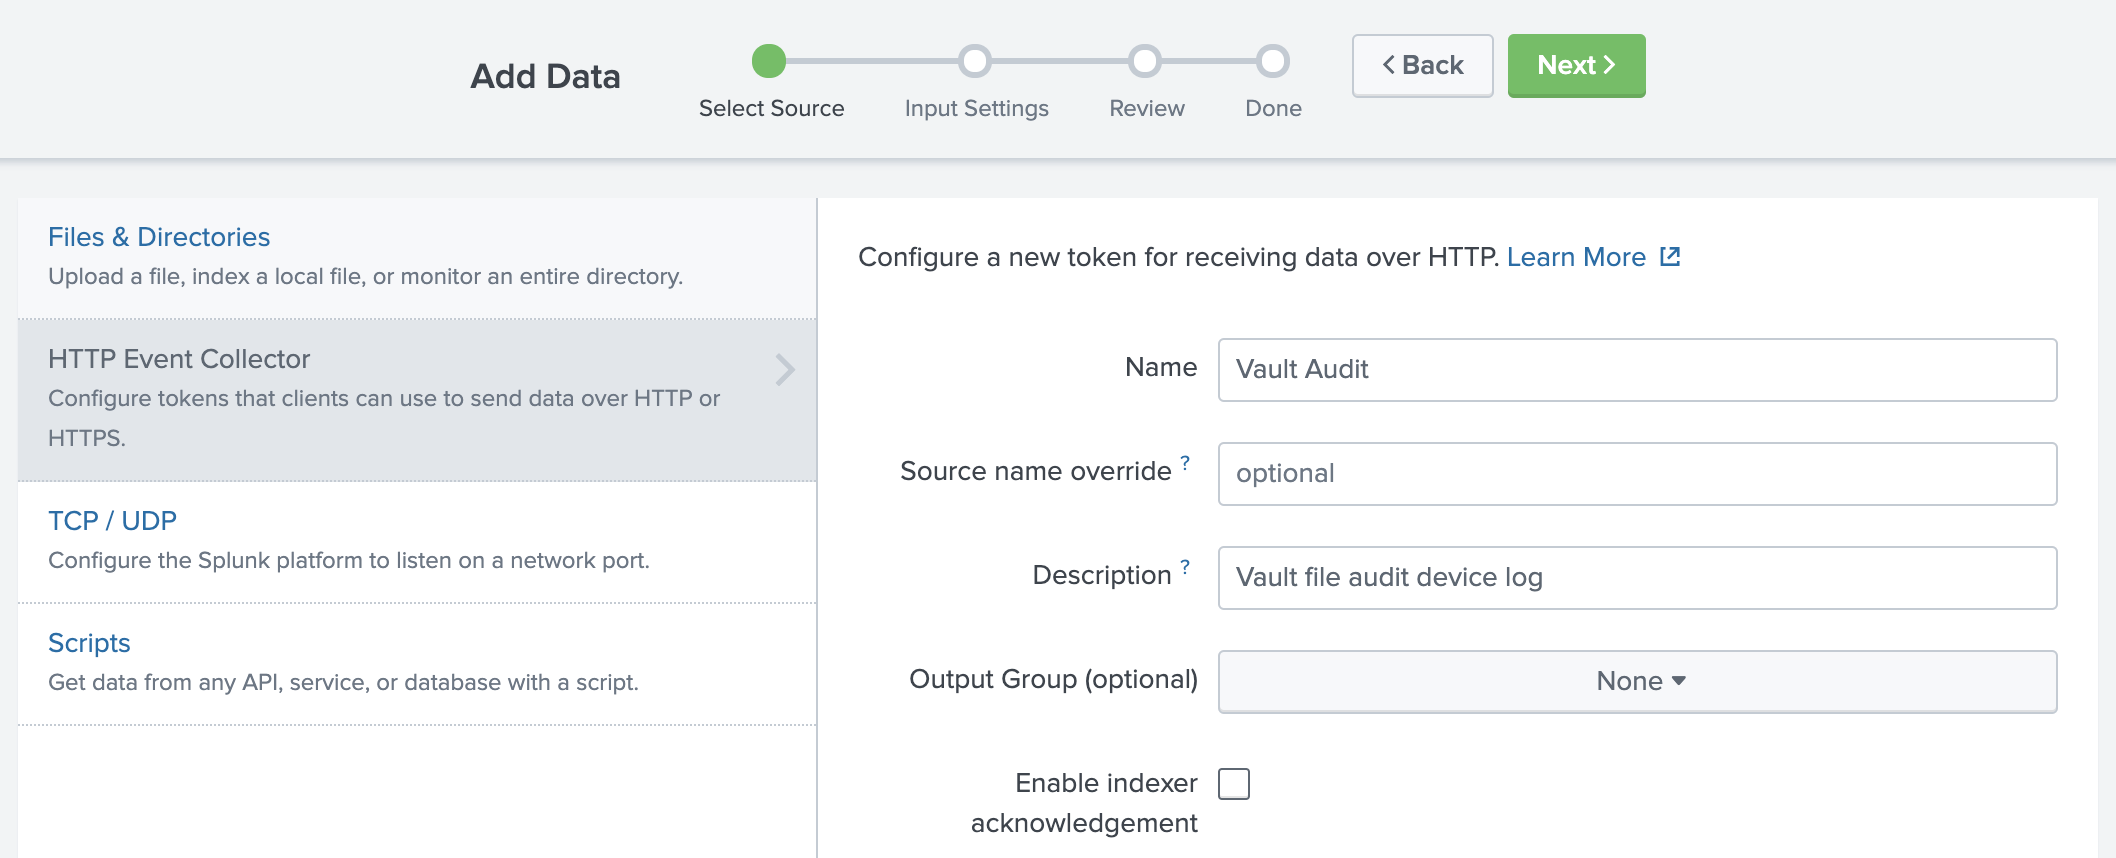
First, configure the Select Source settings.
- For Name, enter
Vault Audit. - For Description, enter
Vault file audit device log. - Click Next.
Then, configure the Input Settings.
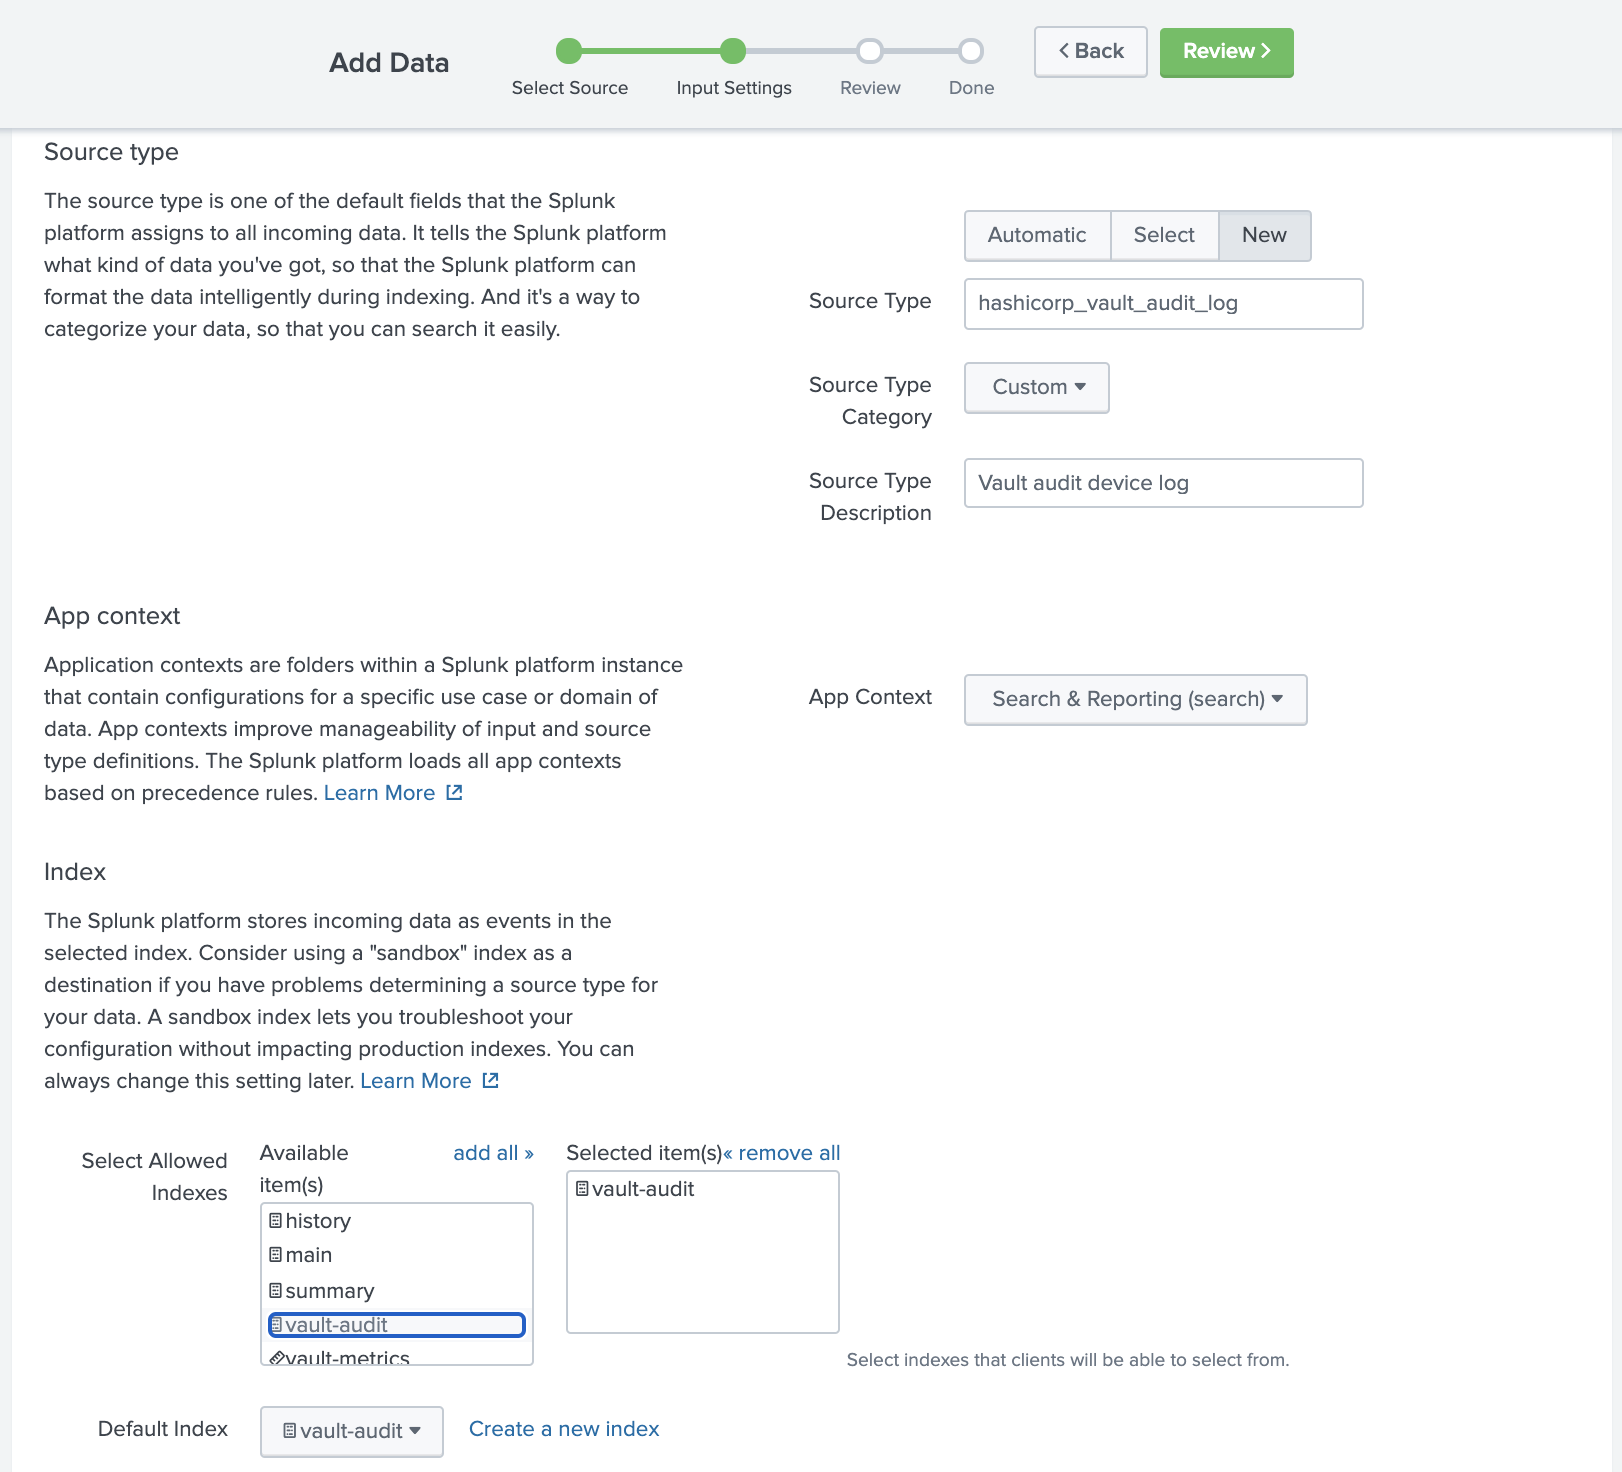
- From the Input Settings page click New next to Source type.
- For Source Type, enter
hashicorp_vault_audit_log. - For Source Type Description, enter
Vault file audit device log. - Now, scroll down to the Index section.
- Click vault-audit to select it as an allowed index.
- Click Review.
- Click Submit.
You should observe a token creation message and dialog as shown in the screenshot.

Copy the complete value from Token Value and save it for later use when configuring Fluent Bit.
Add HEC for Vault telemetry metrics
Add the HEC for Vault telemetry metrics and save the resulting token for later use with the Fluent Bit configuration.
- From the Splunk Web navigation menu, select Settings.
- From under the Data menu, select Data inputs.
- Under the Local inputs section, click Add new beside HTTP Event Collector.
Follow this stepwise process to configure the HEC as shown in the examples.
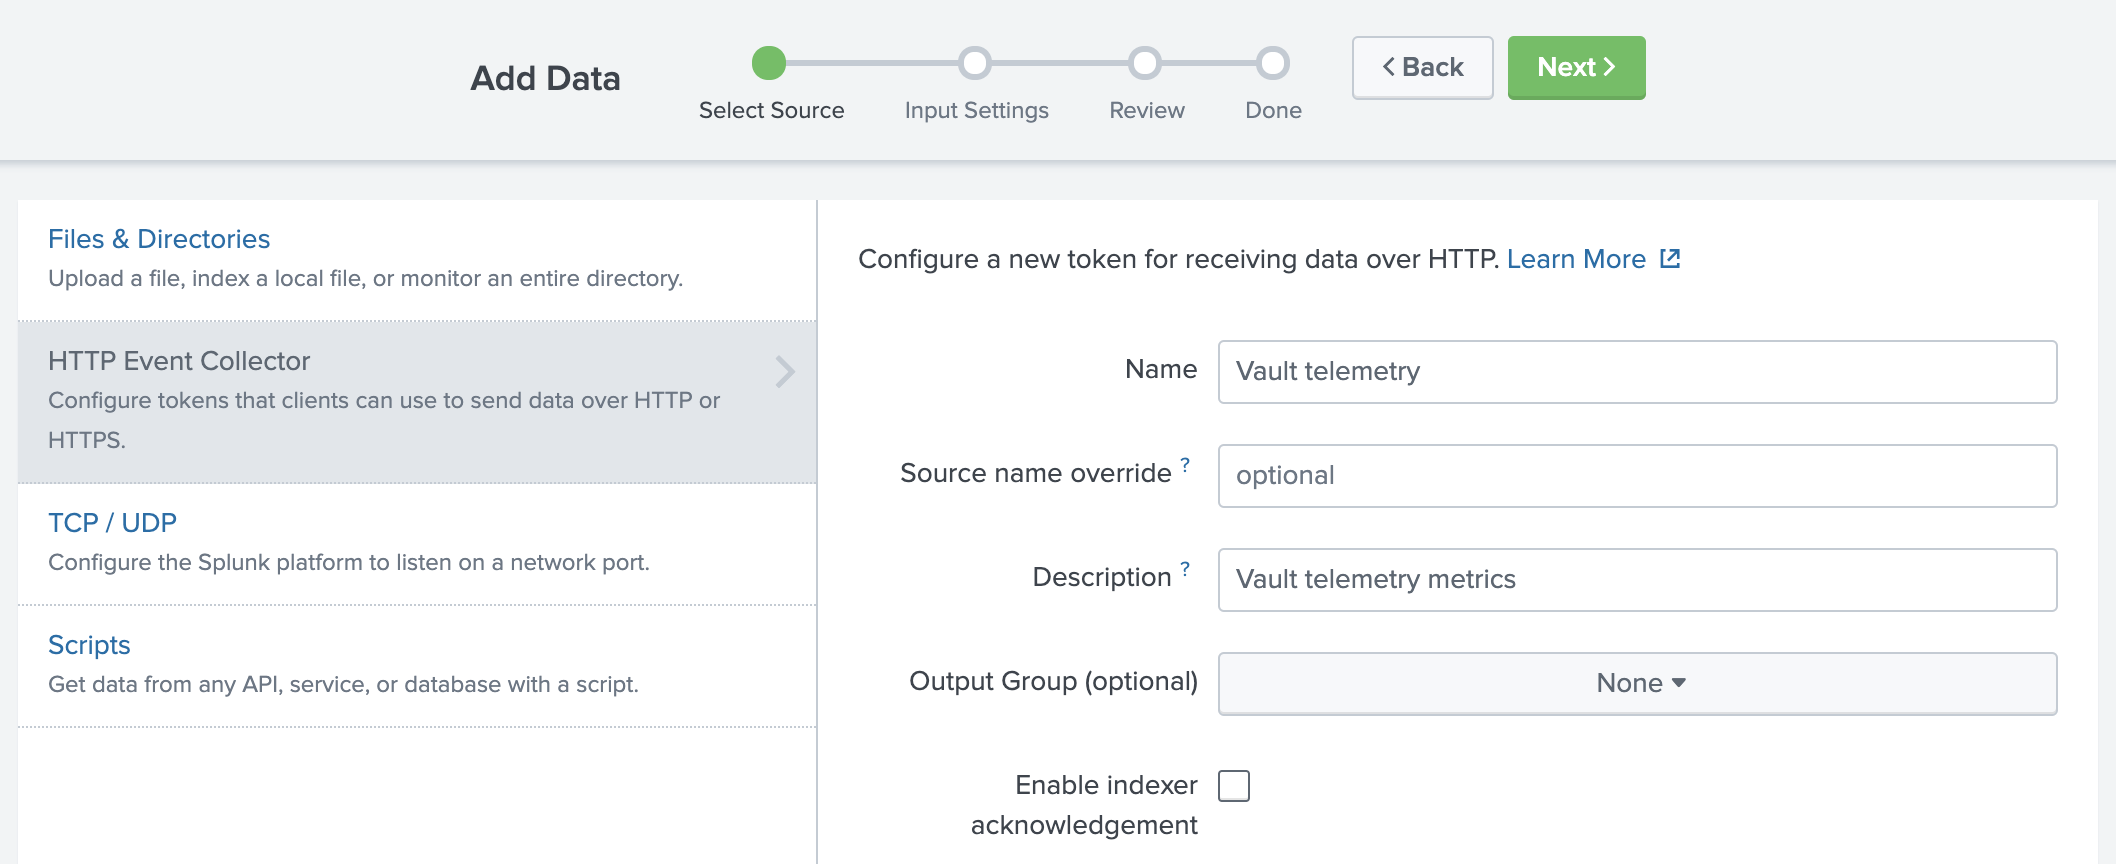
First, configure the Select Source settings.
- For Name, enter
Vault telemetry. - For Description, enter
Vault telemetry metrics. - Click Next.
Then, configure the Input Settings.
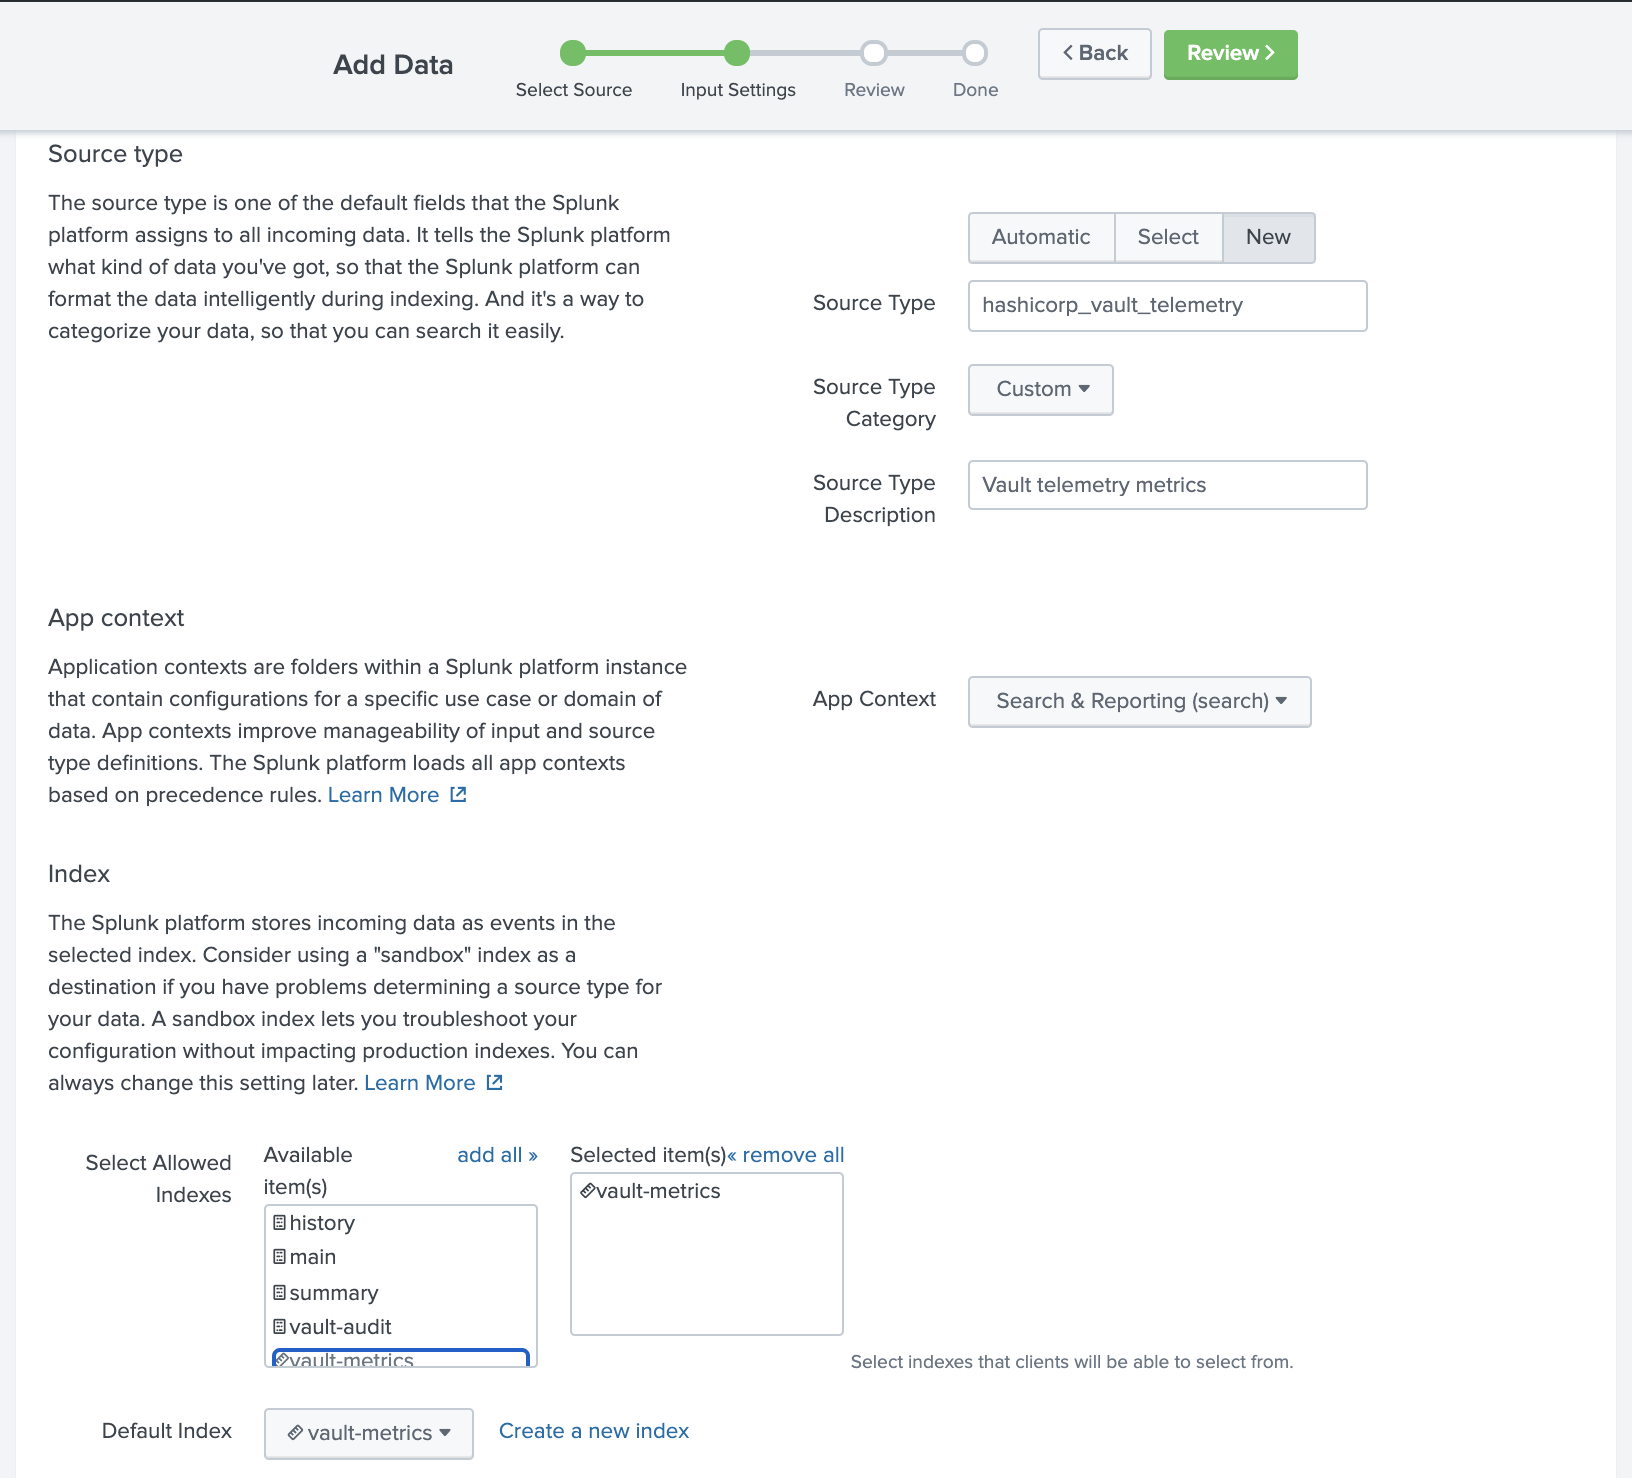
- From the Input Settings page click New next to Source type.
- For Source Type, enter
hashicorp_vault_telemetry. - For Source Type Description, enter
Vault telemetry metrics. - From the Input Settings page scroll down to the Index section.
- Click vault-metrics to select it as an allowed index.
- Click Review.
- Click Submit.
You should observe a token creation message and dialog as shown in the screenshot.
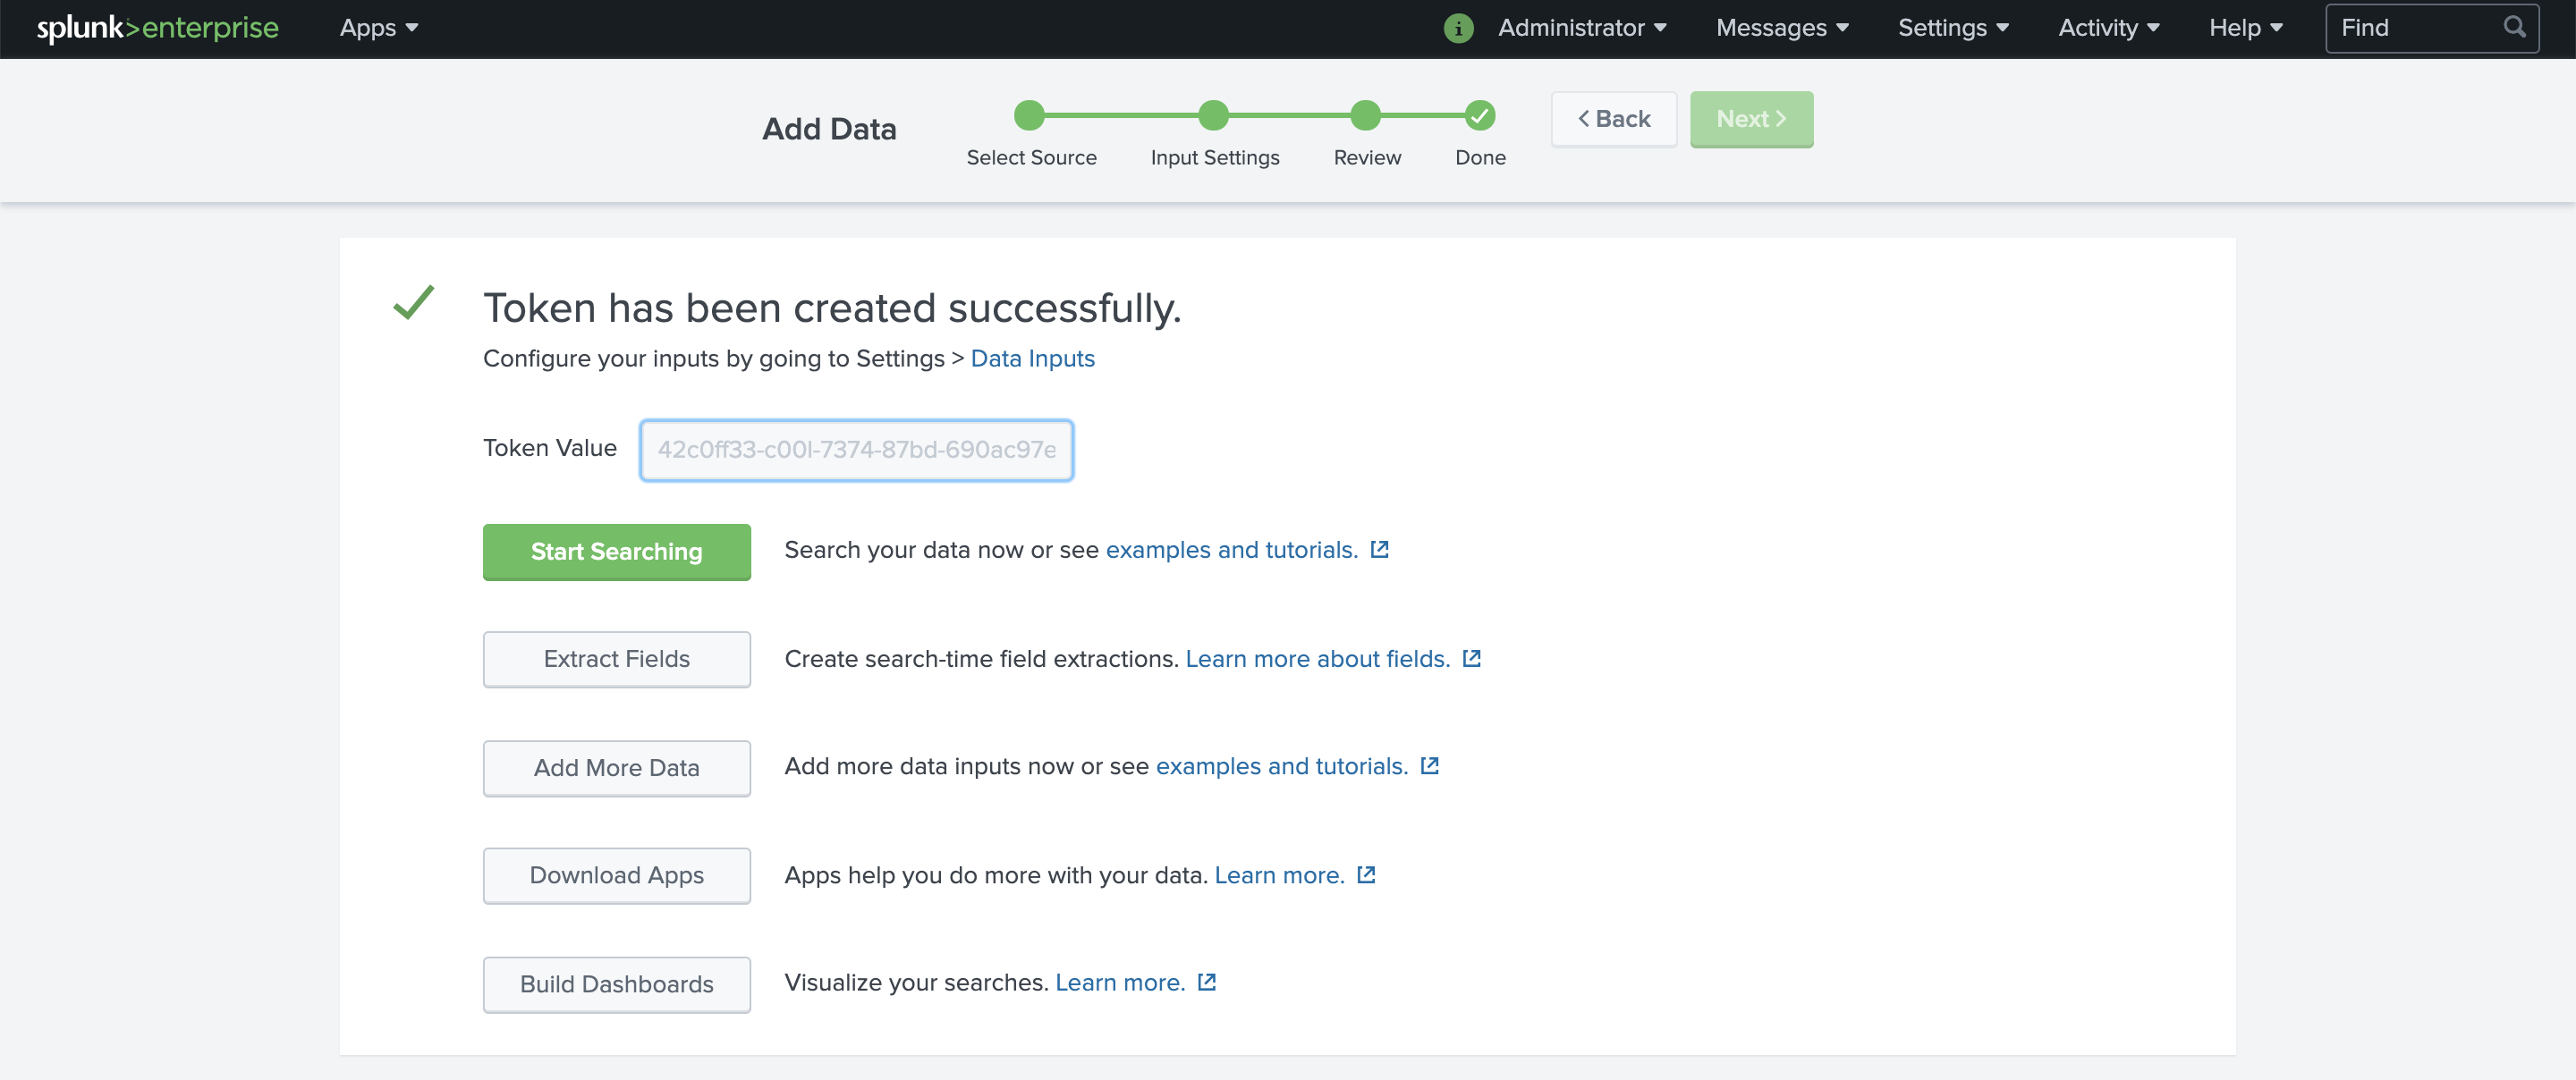
Copy the complete value from Token Value and save it for later use when configuring Fluent Bit.
Disable SSL on HEC
Splunk enables SSL with a self-signed certificate by default, including for the HEC listeners. To deactivate SSL on all HEC listeners, access the HEC global settings.
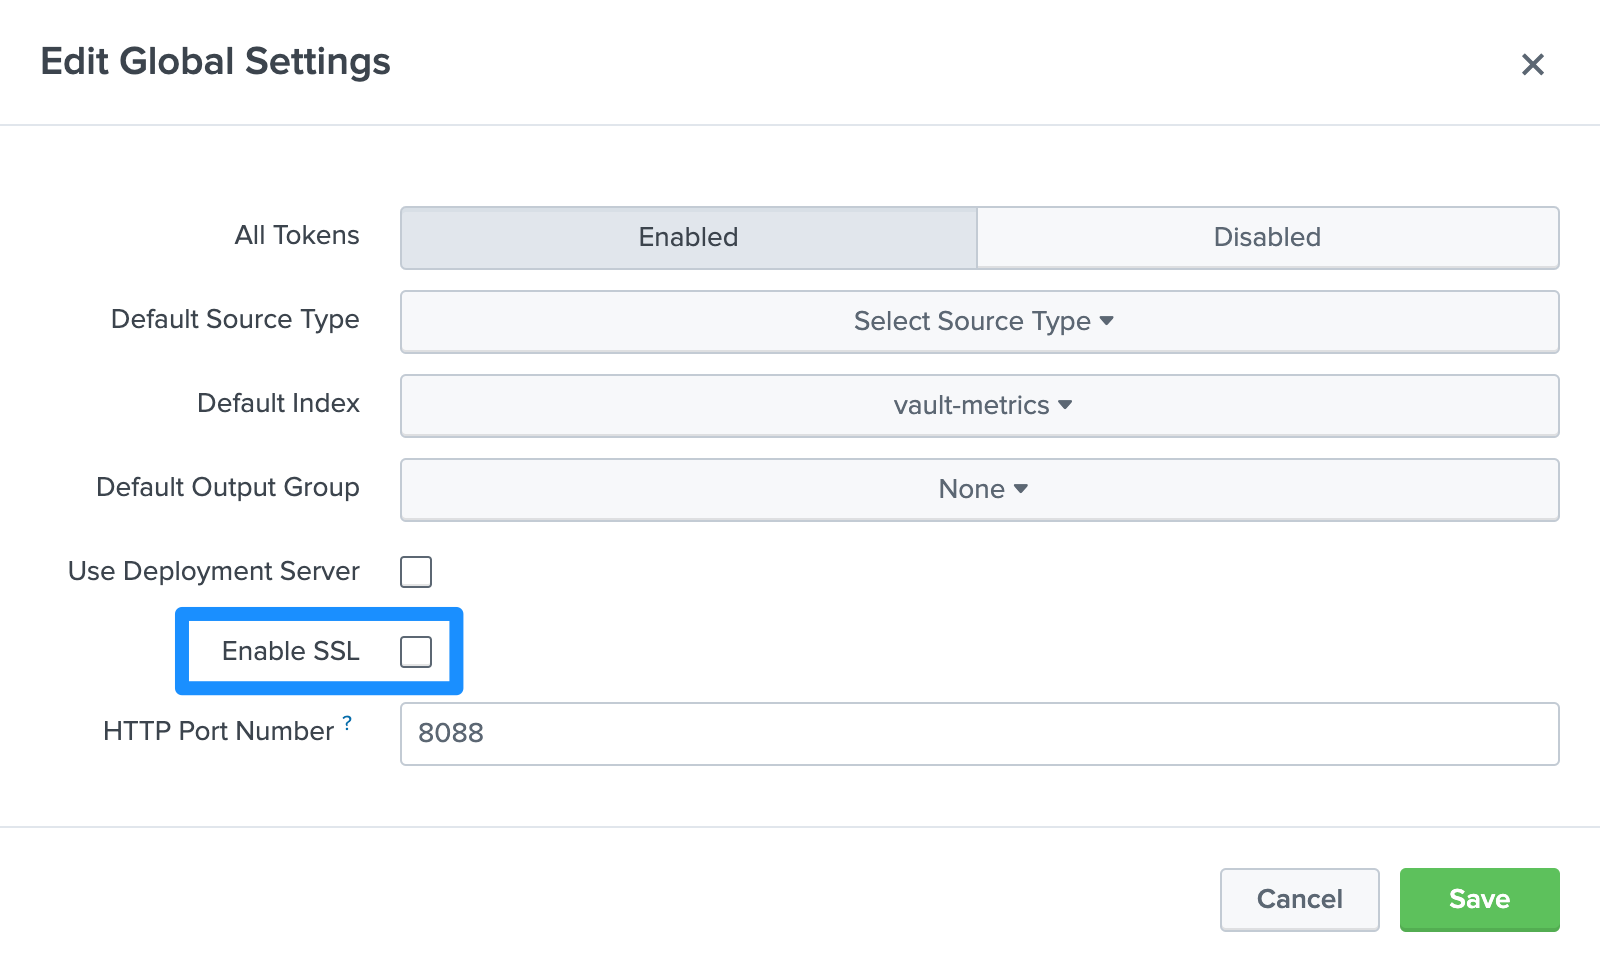
- From the Web Splunk navigation menu, select Settings.
- From under the Data menu, select Data inputs.
- Click HTTP Event Collector.
- Click Global Settings.
- Uncheck Enable SSL.
- Click Save.
Add indexes to admin role
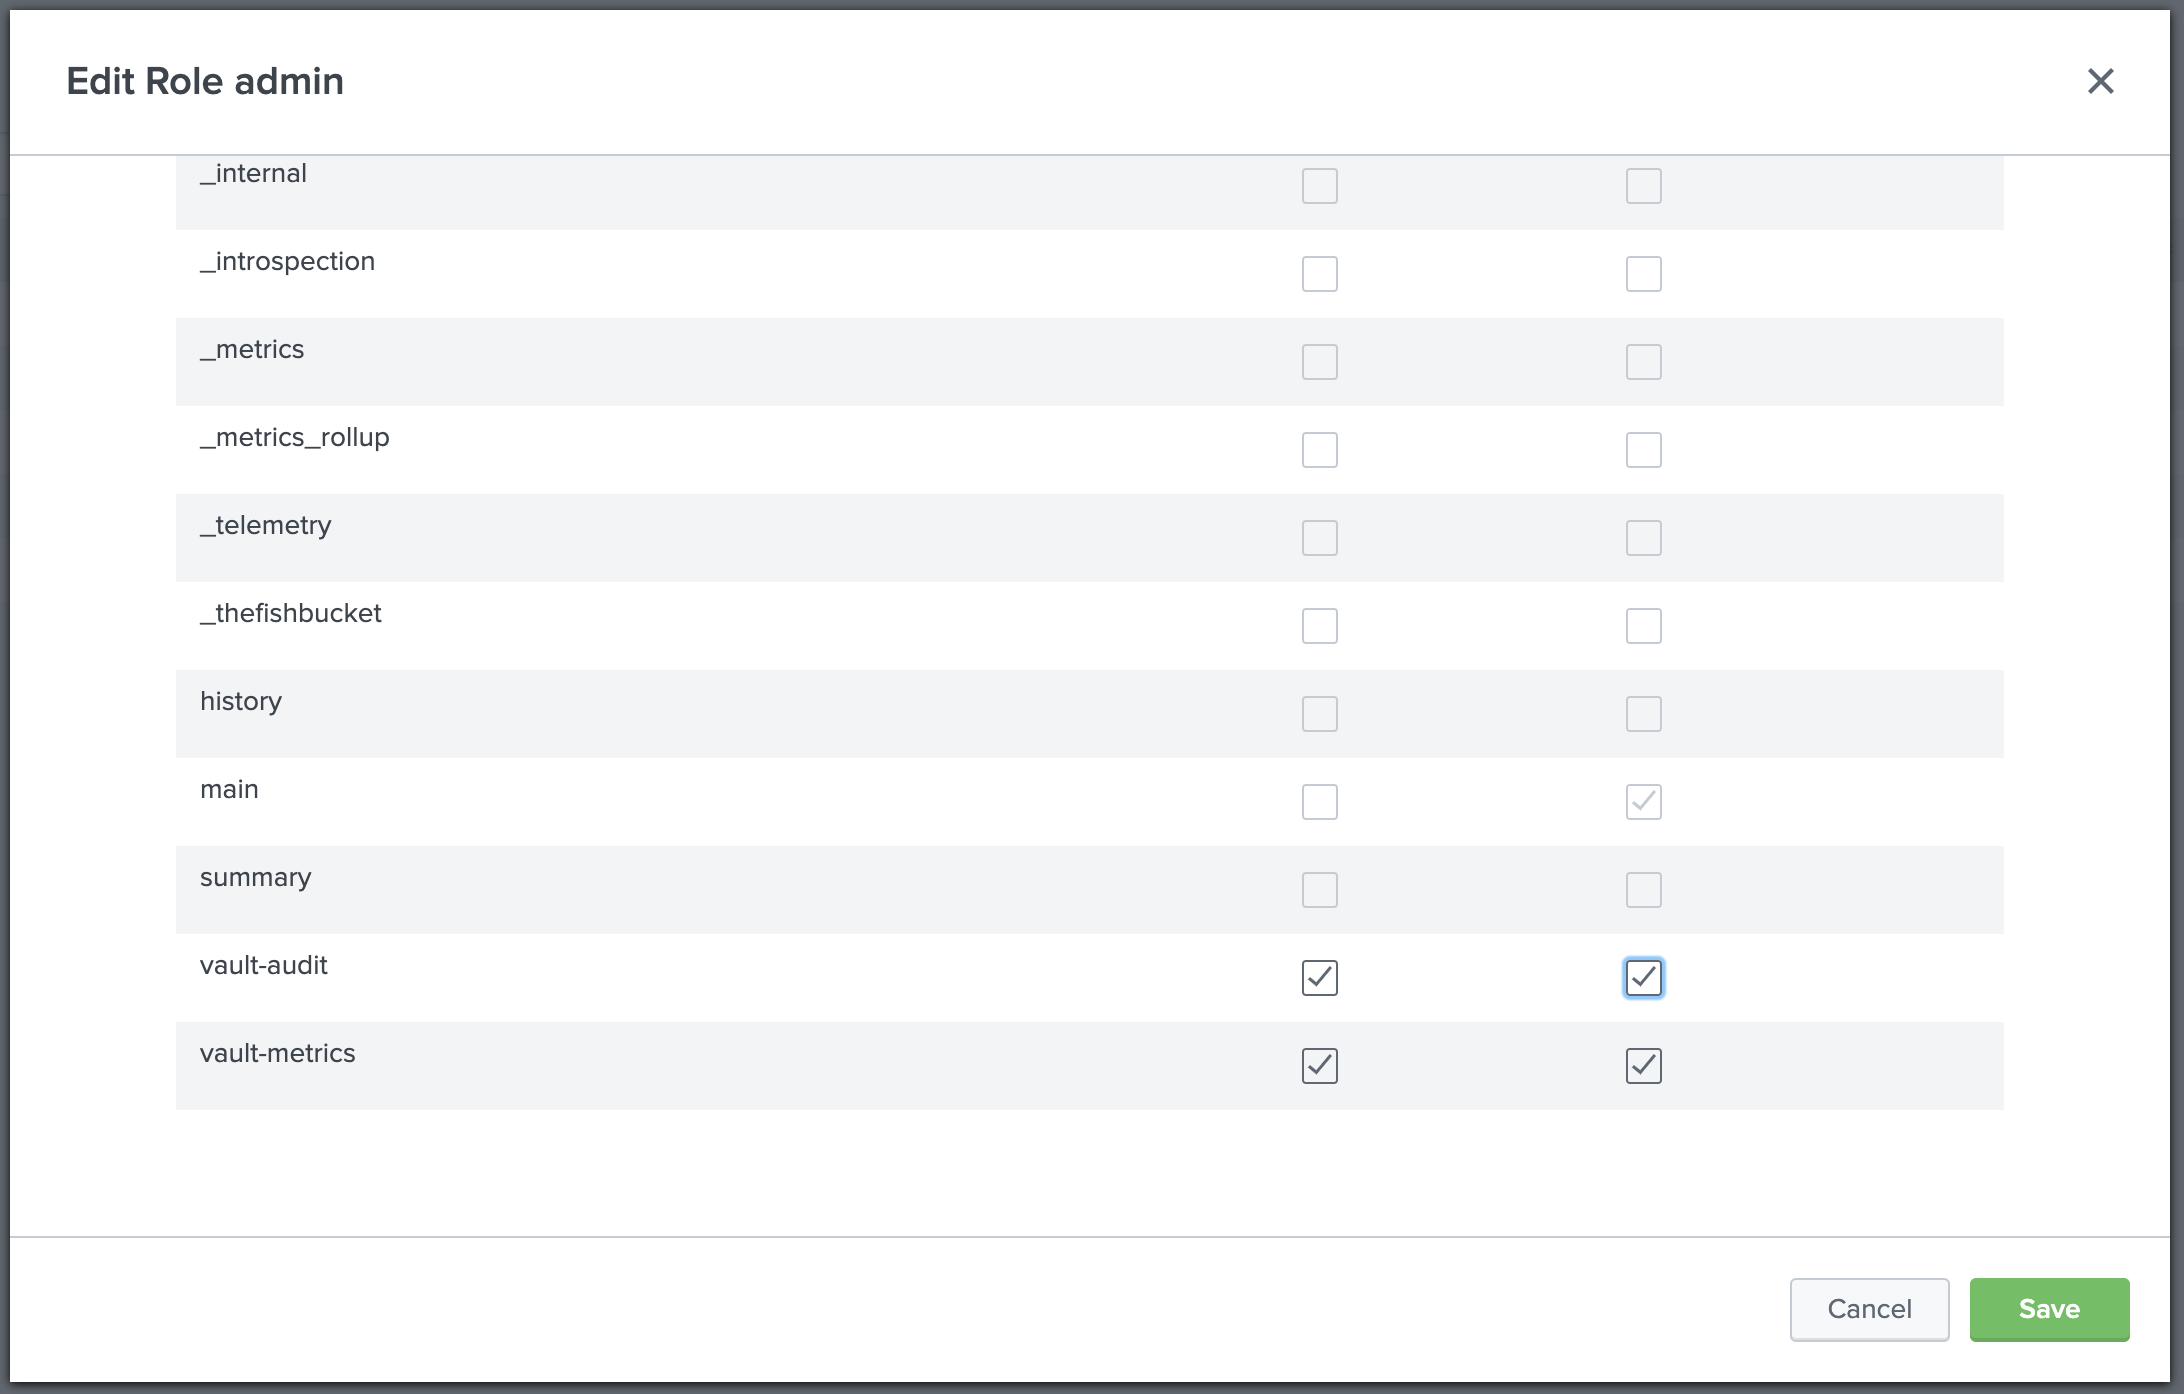
Enable the vault-audit and vault-metrics indexes for the admin role so that searches work as expected.

- From the Web Splunk navigation menu, select Settings.
- From under the USERS AND AUTHENTICATION section, select Roles.
- Click admin.
- Click 3. Indexes.
- Scroll to the bottom of the indexes list.
- Check the check-boxes for both the Included and the Default columns for both vault-audit and vault-metrics indexes.
- Click Save.
This completes the Splunk configuration.
You are now ready to configure Fluent Bit.
Configure Fluent Bit
You can install Fluent Bit as an agent on your Vault servers to consume both audt device log data and telemetry metrics data. Fluent Bit also enables system resource metrics like CPU and memory usage.
You configure the Fluent Bit agent with a YAML formatted configuration file, named fluent-bit.yaml for this example.
The following Fluent Bit configuration establishes three data pipelines: audit logs from file tail input, telemetry metrics from statsd input, and system metrics from CPU, memory, and disk inputs. Each pipeline forwards data to Splunk via HTTP Event Collector using the tokens created in previous steps.
# Fluent Bit example configuration for Vault servers

# local environment variables
env:
    flush_interval: 1

# service configuration
service:
    flush:       ${flush_interval}
    log_level:   info
    http_server: off
    hc_http_status: on
    hc_period: 5
    hc_errors_count: 5
    hc_retry_failure_count: 5

parsers:
  - name: json
    format: json
  - name: vault_audit
    format: json
    time_key: time
    time_format: '%Y-%m-%dT%H:%M:%S %z'

pipeline:
    inputs:
        # Vault file audit device
        - name: tail
          path: /vault/logs/vault_audit.log
          parser: json
          tag: vault-audit
        # Vault telemetry metrics
        - name: statsd
          listen: 0.0.0.0
          metrics: on
          port: 8125
          tag: vault-metrics
        # System metrics
        - name: cpu
          tag: vault-system
        - name: disk
          tag: vault-system
          interval_sec: 1
          interval_nsec: 0
        - name: mem
          tag: vault-system
        - name: netif
          tag: vault-system
          interval_sec: 1
          interval_nsec: 0
          interface: ens4
        - name: proc
          proc_name: vault
          interval_sec: 1
          interval_nsec: 0
          fd: true
          mem: true
          tag: vault-system
    outputs:
        - name: splunk
          match: vault-metrics
          host: 127.0.0.1
          port: 8088
          splunk_send_raw: on
          splunk_token: 42c0ff33-c00l-7374-87bd-690ac97efc50
          tls: off
        - name: splunk
          match: vault-audit
          host: 127.0.0.1
          port: 8088
          splunk_send_raw: off
          splunk_token: c0ff336f-3fa8-4d17-b67f-78d794f042fb
          tls: off
        - name: splunk
          match: vault-system
          host: 127.0.0.1
          port: 8088
          splunk_send_raw: off
          splunk_token: c97efc50-c00l-7374-87bd-690a42c0ff33
          tls: off
The provided example is generic, but you should update the following values to match your environment.
Update these values under inputs:
- path is the full path to your Vault audit device log file. Specify an existing file audit device log file here or leave the example as-is if you need to enable an audit device. Instructions for enabling a file audit device appear in the Configure Vault section.
Update these values under outputs.
- host is the hostname or IP address of your Splunk server.
- interface is the name of the network interface you want metrics for.
- splunk_token is the HEC token value for the telemetry metrics HEC.
You do not need to change anything in the other stanzas.
There are also some inputs for items like CPU, memory, disk I/O, and network I/O. Most of them don't require any configuration, but make sure
the interface matches the interface name you observe in ip addr or ifconfig output on the appropriate servers.
After you configure Fluent Bit, start the service. You can also check its log output to ensure there are no issues, and move on to configuring Vault for exporting telemetry metrics.
Start or restart the systemd service as necessary:
$ sudo systemctl daemon-reload && sudo systemctl restart fluent-bit
You can check the Fluent Bit logs for signs of any issues. If you do not yet have a running Vault server, the logs can contain warnings or errors about the missing audit device log file. This is both expected, and not a problem as Fluent Bit will keep retrying until it can read the file.
This completes the Fluent Bit configuration.
Configure Vault
Use the telemetry stanza to configure Vault.
Add a variation of the following example to your Vault configuration file, or as a separate configuration file to enable statsd telemetry metrics. This example also deactivates the hostname and hostname label fields.
The following configuration enables Vault to send telemetry metrics to the Fluent Bit statsd input on localhost port 8125. The hostname fields are disabled to reduce metric cardinality.
telemetry {
  disable_hostname = true
  enable_hostname_label = false
  statsd_address = "localhost:8125"
}
The options contained in the example telemetry stanza break down as follows.
- disable_hostname do not enable a hostname field in the metrics; set to
true. - enable_hostname_label enable a hostname label from the metrics source; set to
false. - statsd_address specifies the address of a statsd server to forward metrics to; set to the Fluent Bit agent's statsd input listening on localhost.
Once you have Vault configured, you need to start or restart it as required.
After Vault is available for use and you authenticate to it with a token that has capabilities to enable an audit device. You can then enable a file audit device instance (if you won't be using an existing one).
Enable file audit device
Unless you can reuse an existing file audit device, the last step in Vault configuration requires that you enable one.
First, ensure that the vault process user has permission to write to the target log output directory, /var/log in this example.
Then, use the vault CLI to enable a file audit device that writes audit request and response data to the file /vault/logs/vault-audit.log. The mode parameter shown here is just for this tutorial example, and you should set a mode that makes sense for your specific use case.
$ vault audit enable file file_path=/vault/logs/vault-audit.log mode=644
Successful example output:
Success! Enabled the file audit device at: file/
Now that you've configured Vault, you can begin to explore the audit device and metrics data in Splunk Web.
A Splunk App for Monitoring Vault, which consists of pre-built dashboards and reports, is available with Vault Enterprise. Without the app, you can still build your own dashboards from scratch, as all the data sources are available with all versions of Vault. The following describes how you can explore metrics and search events, along with using some example search queries.
Explore metrics
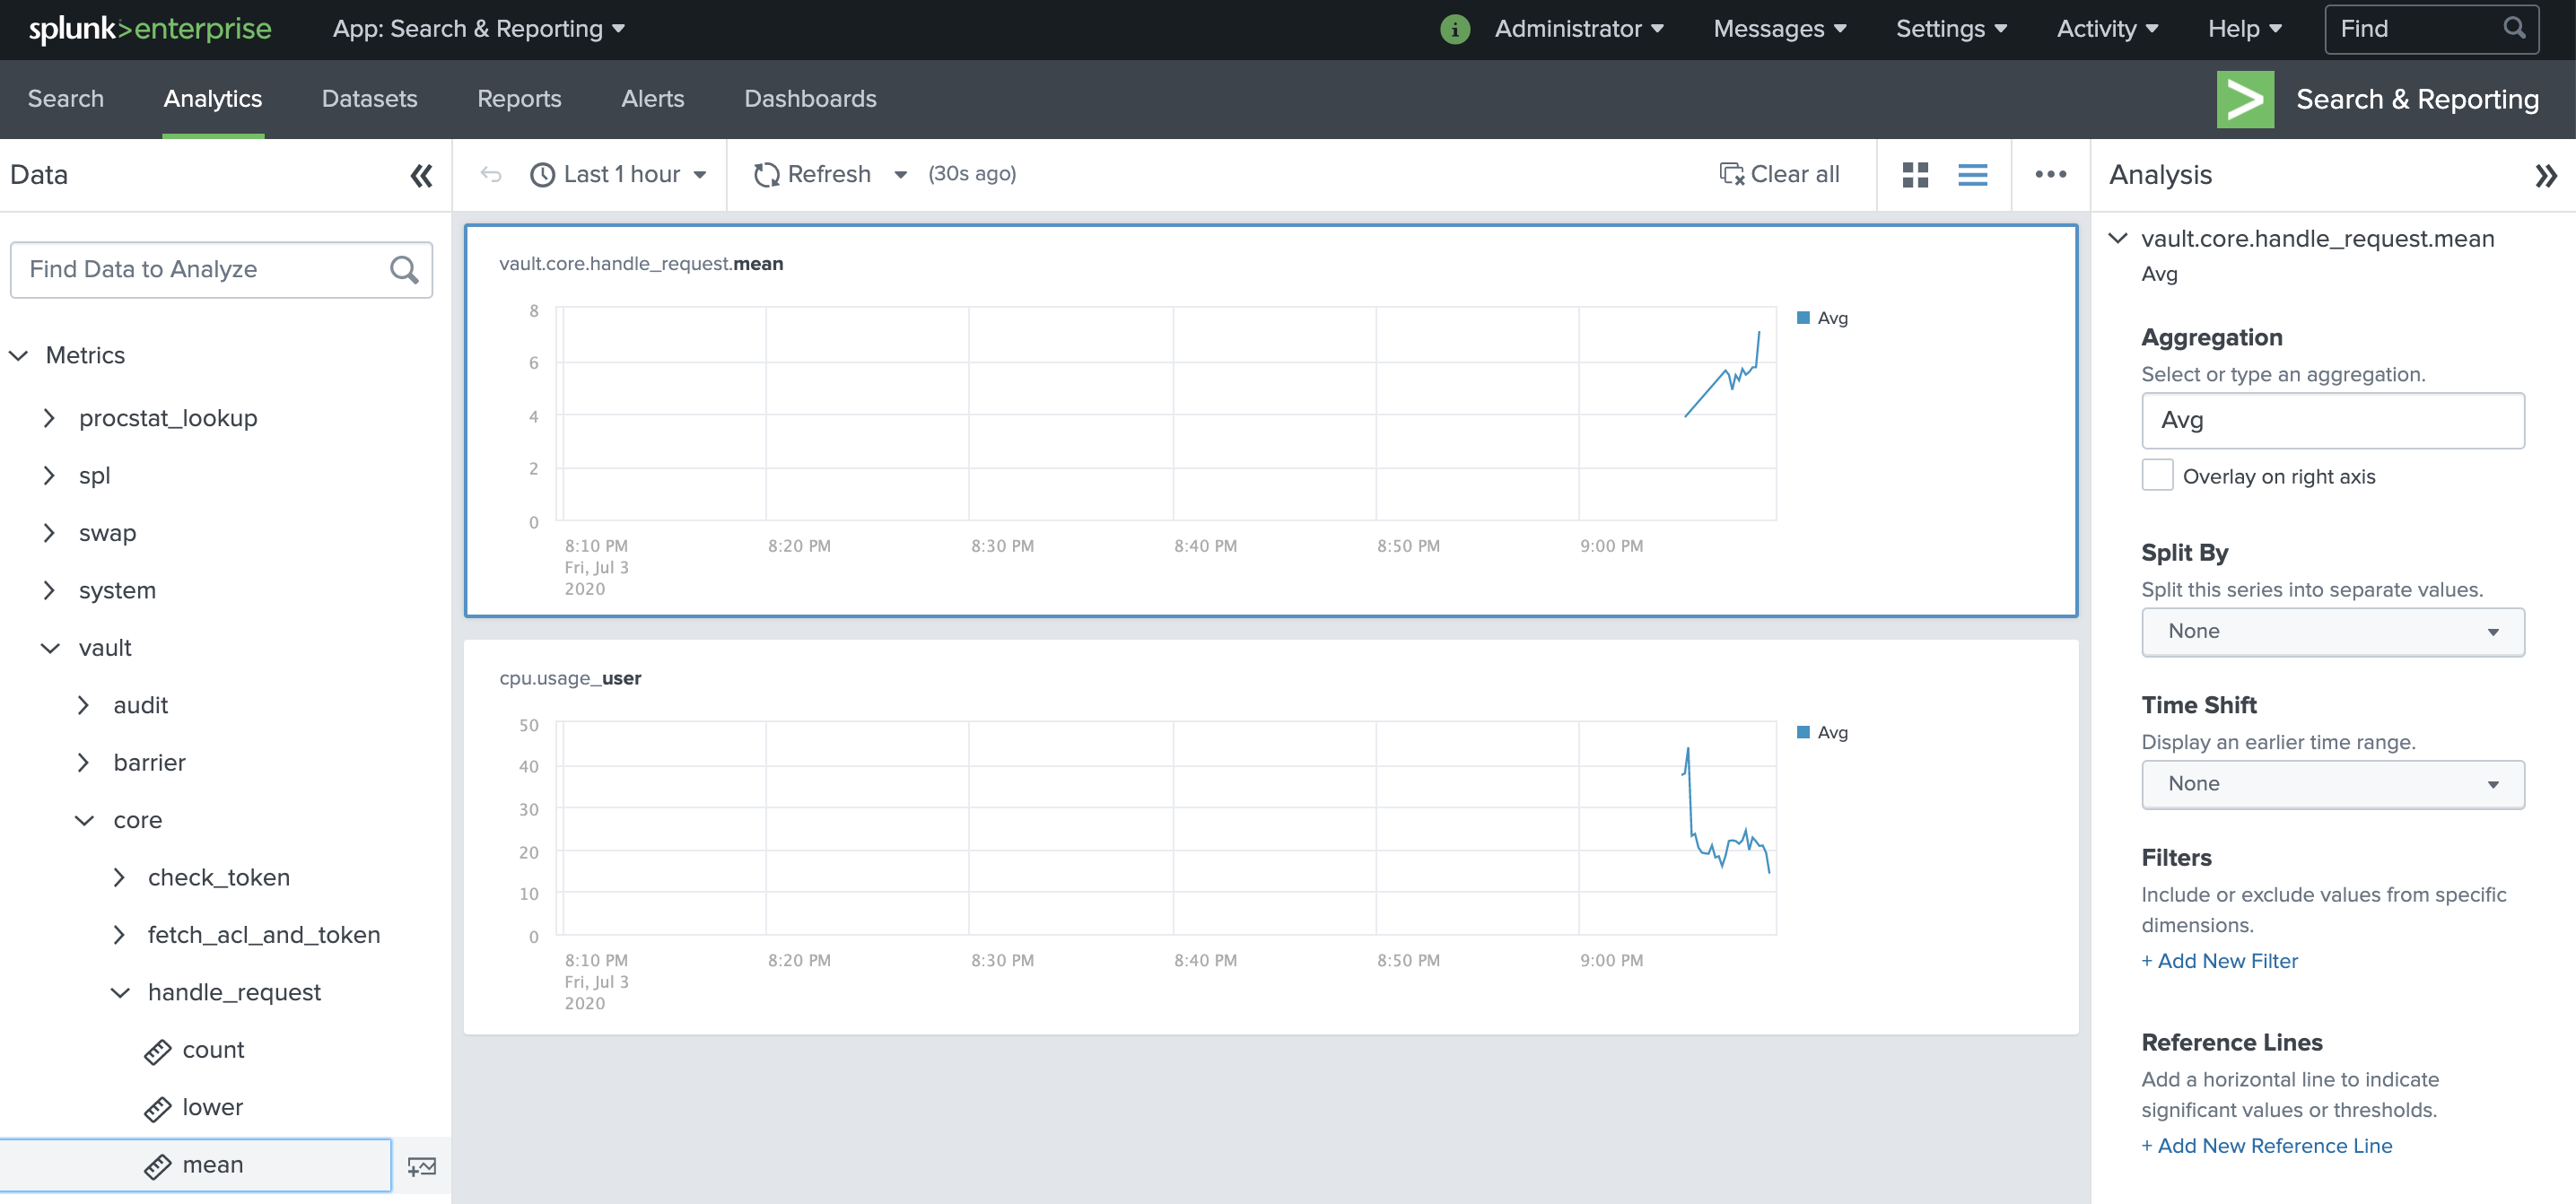
You can explore the metric data in Splunk to learn more about what is available.
- Click the Splunk Enterprise logo image to reach the Splunk Web home page.
- Click Search & Reporting.
- Click Analytics.
- Click Metrics to drill into the metrics.
From here, you can explore all the Vault metrics. By browsing here and finding metrics to chart, you can add them to dashboards for reuse.
Search events
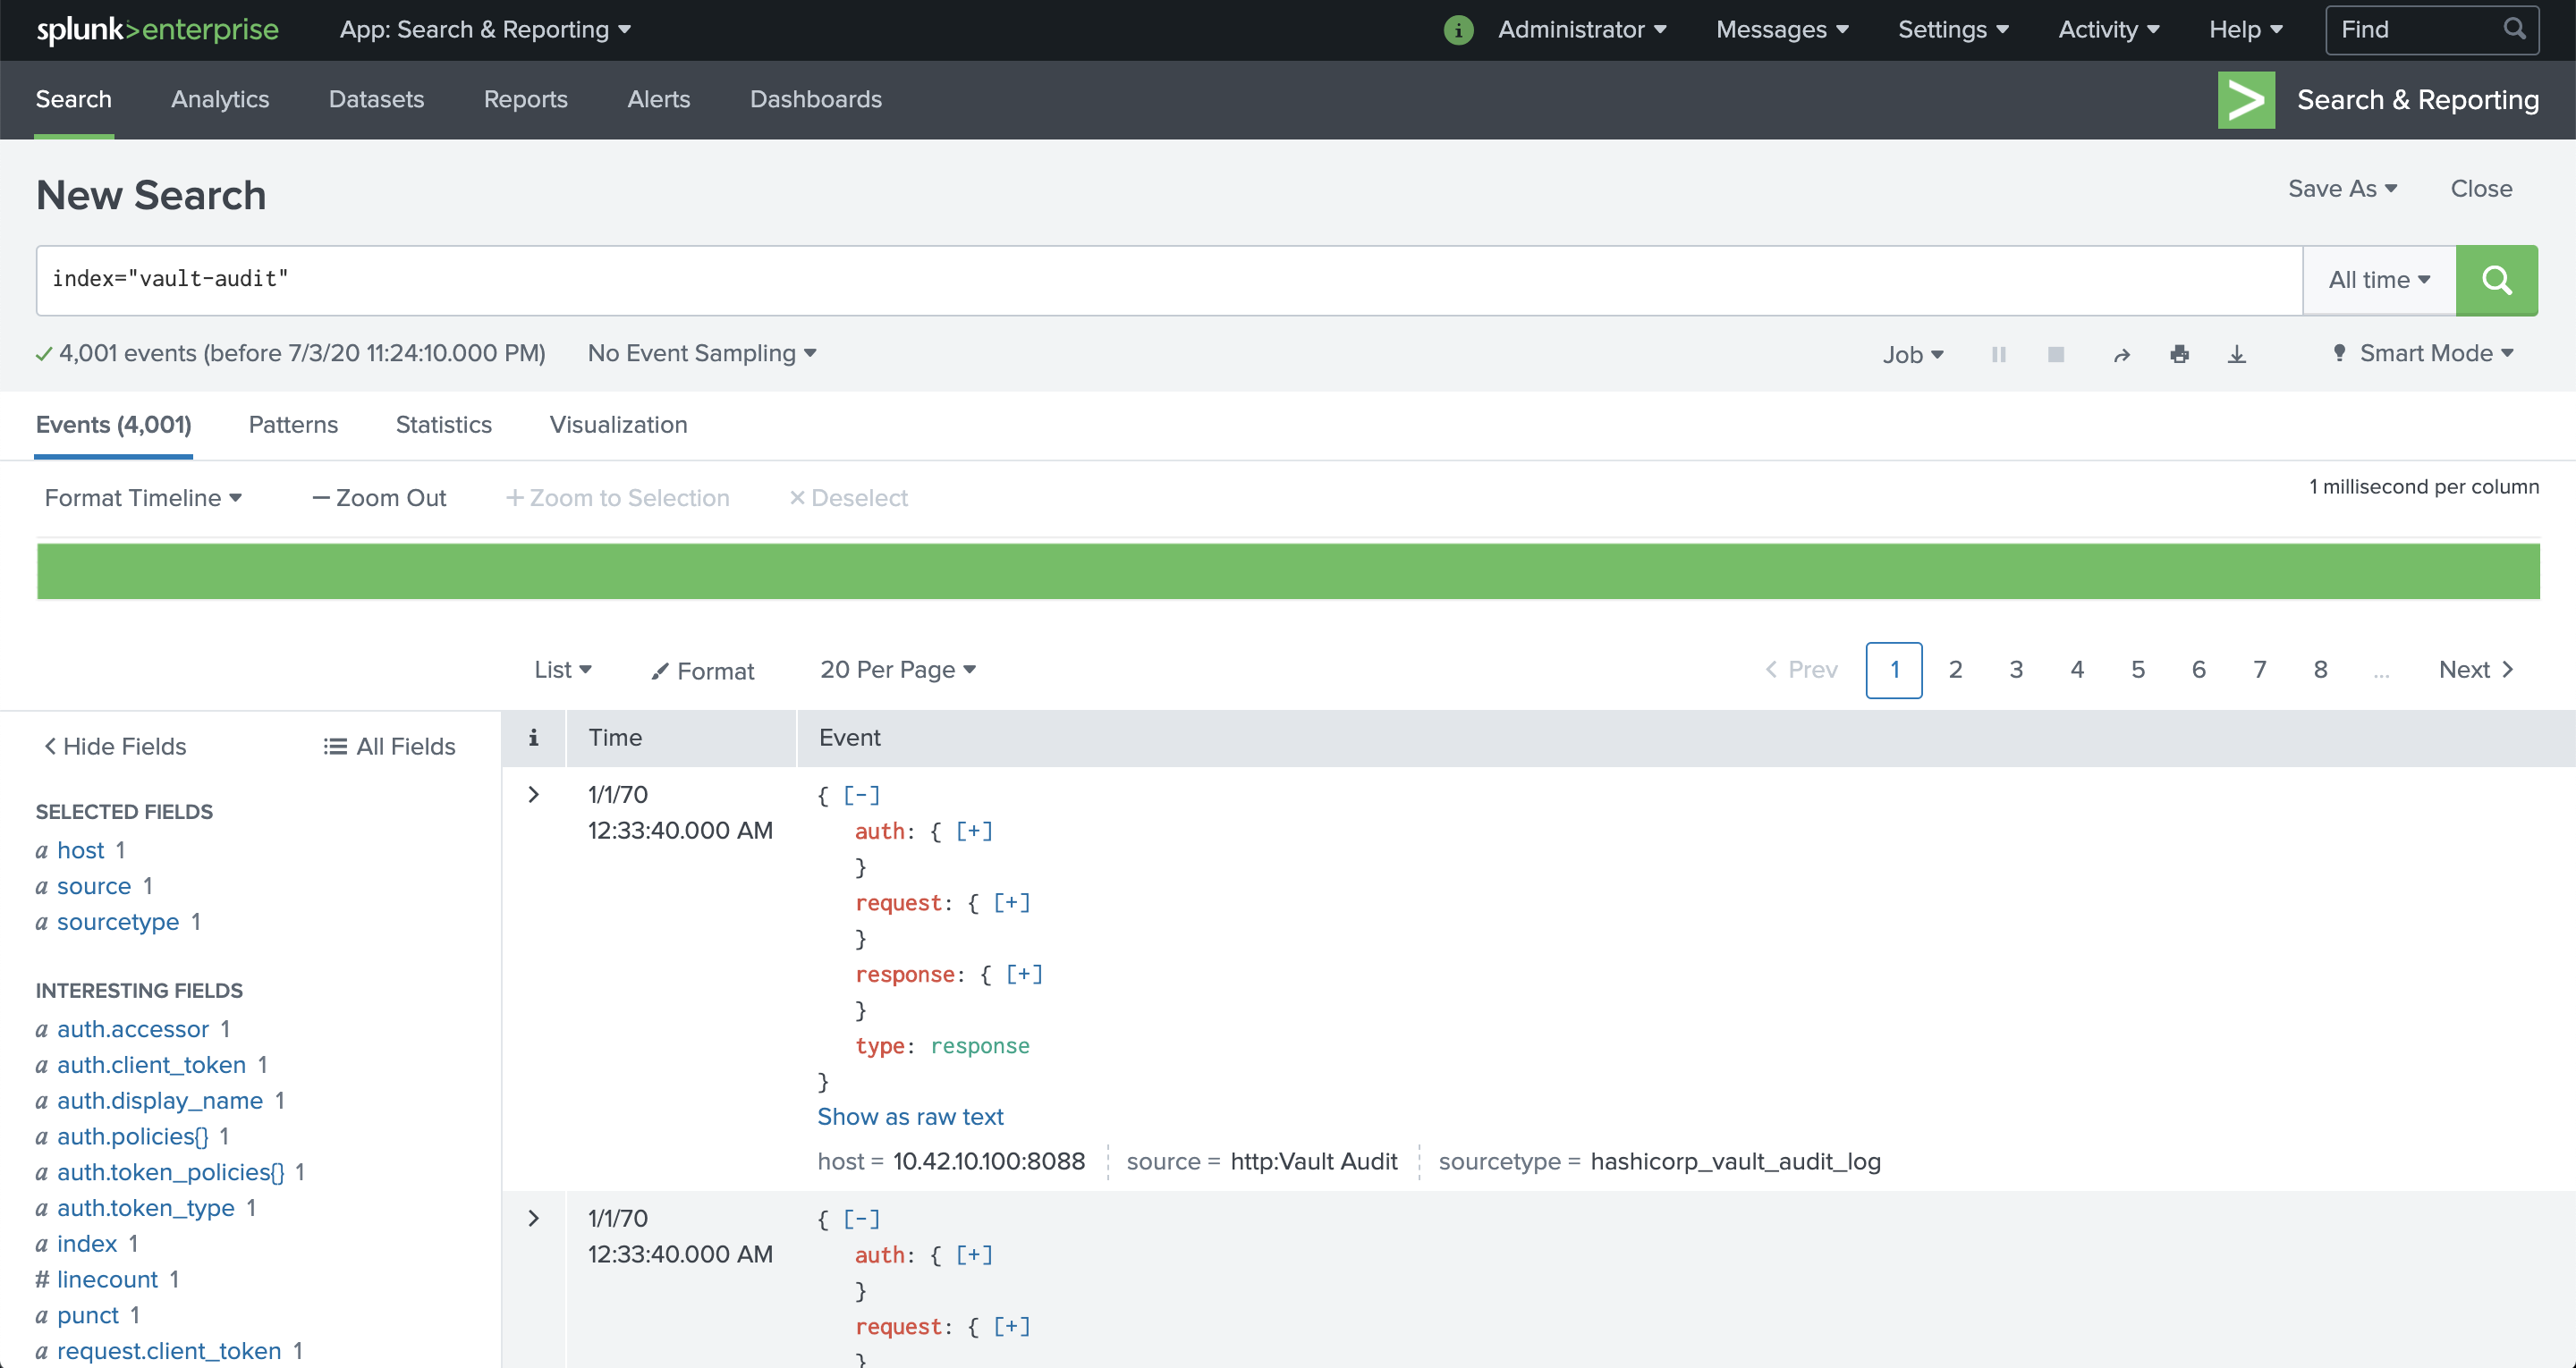
You can also explore the audit device log events in a similar manner as the metrics.
- Click the Splunk Enterprise logo image to reach the Splunk Web home page.
- Click Search & Reporting.
- In the search field, enter
index="vault-audit". - You should observe some results similar to the examples in the screenshot.
Example search queries
Suppose you want to examine the time-to-live assigned to all tokens created in the past 24 hours. Access the search bar, and use the vault.token.creation metric, to obtain the total across all clusters in the index like this example.
| mstats sum(vault.token.create) AS count WHERE index=vault-metrics BY creation_ttl
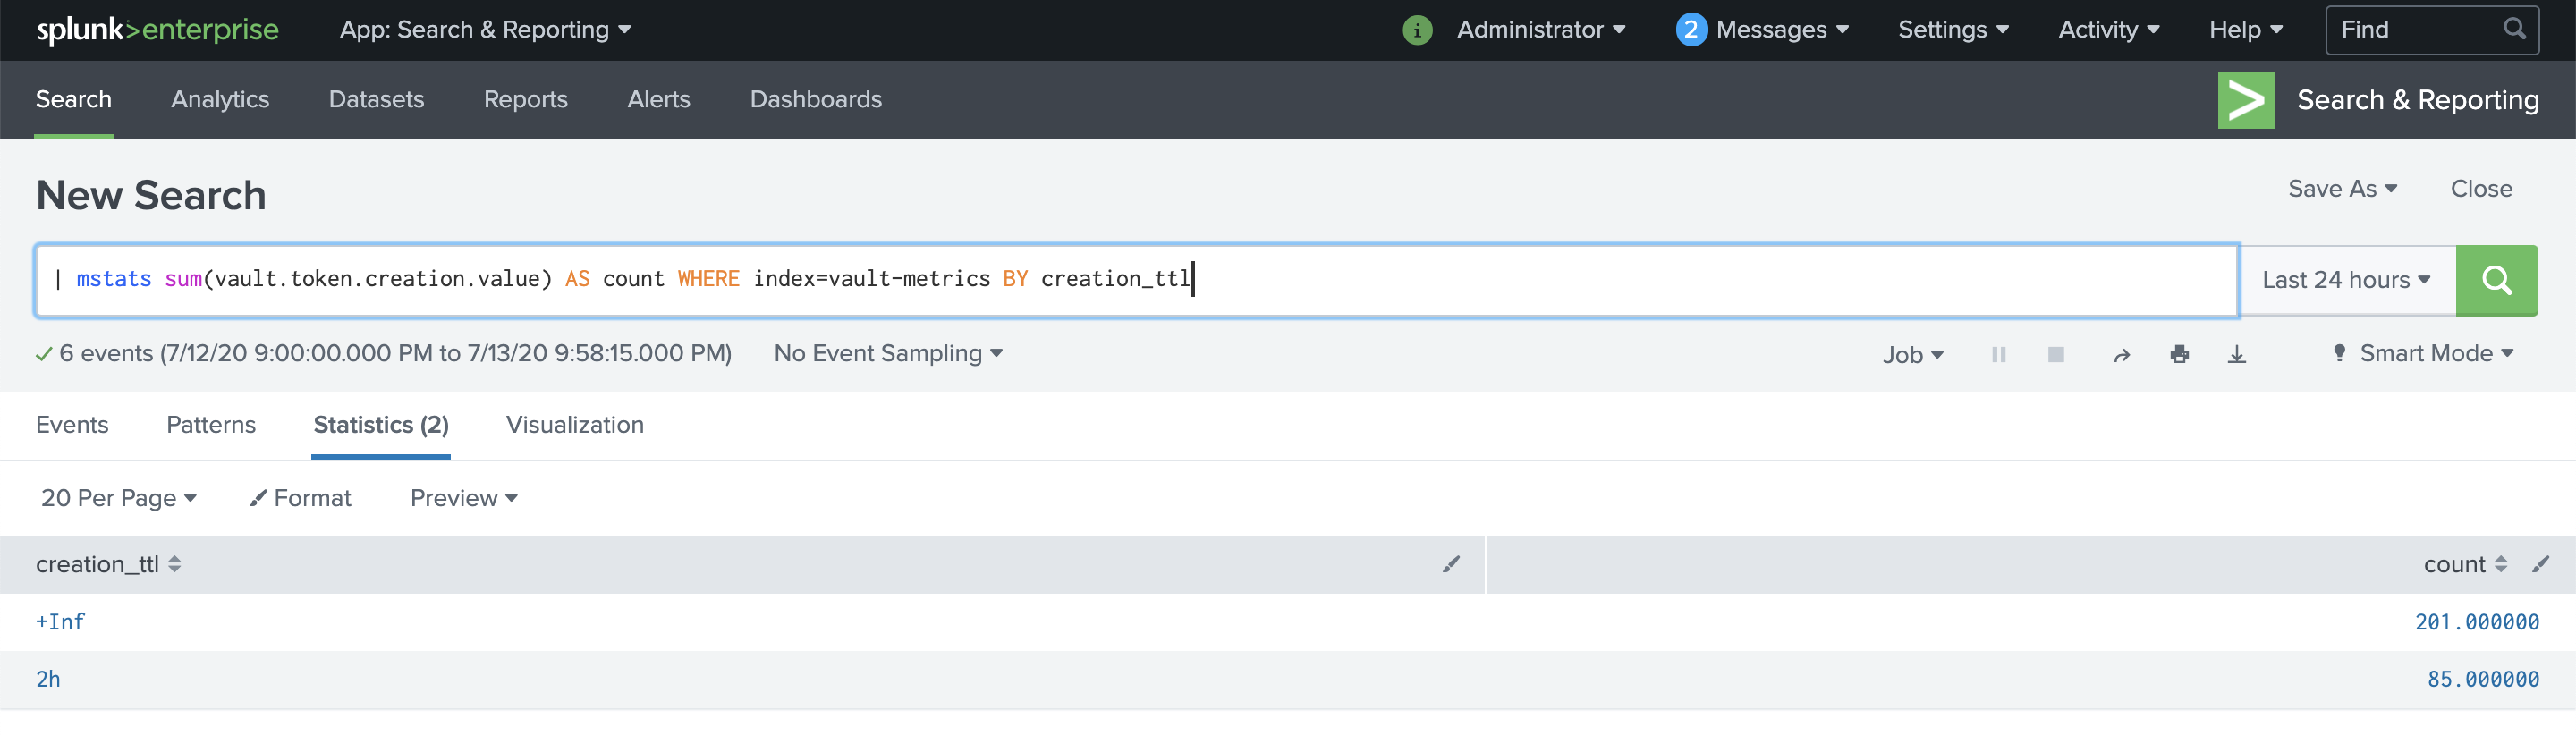
You should observe something like the example screenshot as a result. Note the count is 85 for tokens having a 2 hour TTL, and 201 for tokens having an infinite TTL in the example screenshot.
Selecting a different time range returns the total over that range. The interface displays data as an interactive table that you can sort by any of the columns.
You can augment this search to limit it to a particular cluster, auth method, or mount point, or further break down the query by any of these labels.
For example, to examine the mount points which are creating large numbers of long-lived tokens use a search query like this example.
| mstats sum(vault.token.create) AS count WHERE index=vault-metrics AND cluster=<your-cluster> AND creation_ttl=+Inf BY mount_point
Be sure to the change example value <your-cluster> to the actual cluster_name of the Vault cluster for which you need to search metrics.
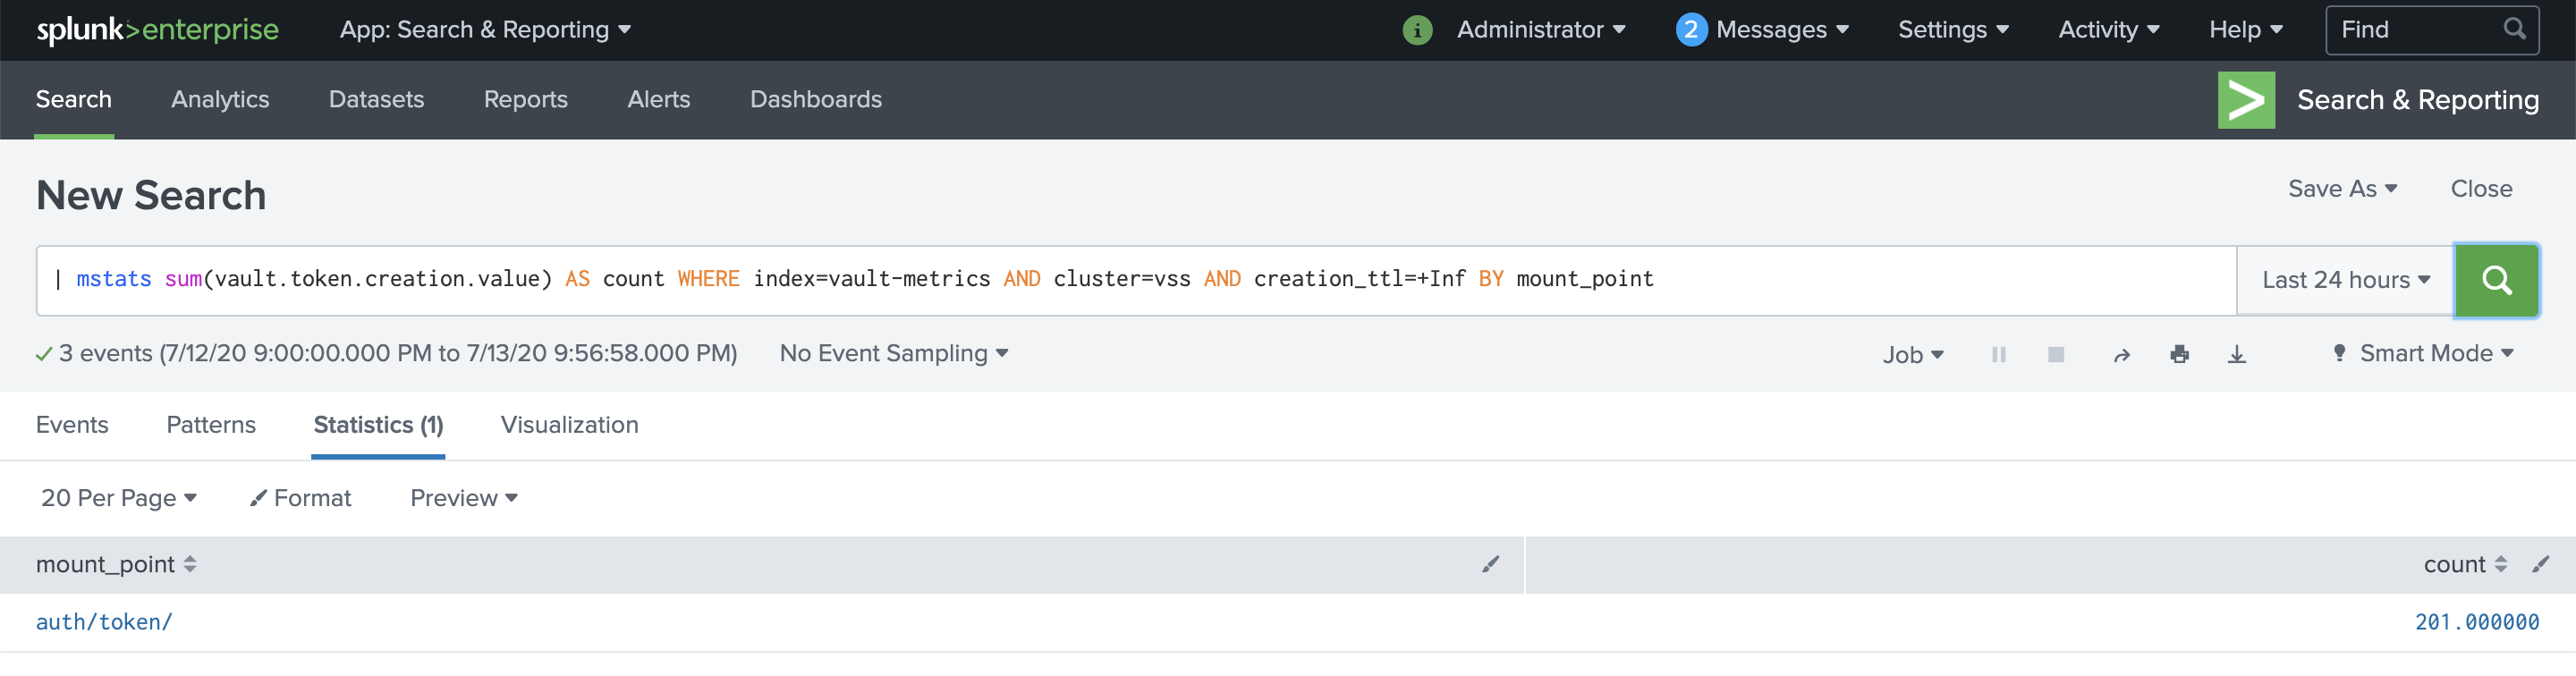
You should observe something like the example screenshot as a result. Note the count is 201 for tokens issued from the auth/token endpoint in the example screenshot. If there were more auth methods enabled you can expect to also notice those listed here with their respective counts.
To get a time series instead, add 'span=30m" to the end of the query to get one data point per 30 minutes.
Example dashboard
Try building a simple dashboard around a mix of system information and Vault token creation information.
- Select Search & Reporting.
- Select Analytics.
- In the navigation at left click vault to expand the Vault metrics.
- Scroll down to the bottom of the list.
- Click token.
- Click create.
- In the Analysis section click the drop-down under Aggregation and select Sum.
- Click Chart Settings.
- Select Column.
You should observe a graph like this example.

With one chart ready, make another for token lookups.
- In the left column under Metrics and token click lookup.
- Click Chart Settings.
- Select Area.
You should observe a graph like this example.

Make another graph for allocated bytes of memory to the Vault process.
- In the left column under Metrics scroll down to vault.
- Click runtime.
- Click alloc_bytes.
- Click Chart Settings.
- Select Area.
You should observe a graph like this example.

Make a graph for Vault Integrated Storage FSM GET operations.
- Scroll up in the metrics and click raft_storage.
- Click fsm.
- Click get.
- Click Chart Settings.
- Select Area.
You should observe a graph like this example.

With 4 graphs ready, follow these steps to create a dashboard based on them.

- Click the ellipse button in the upper right area of the middle pane as shown.
- Click Save all charts to Classic Dashboards.
- Complete the Save All To Dashboard dialog.
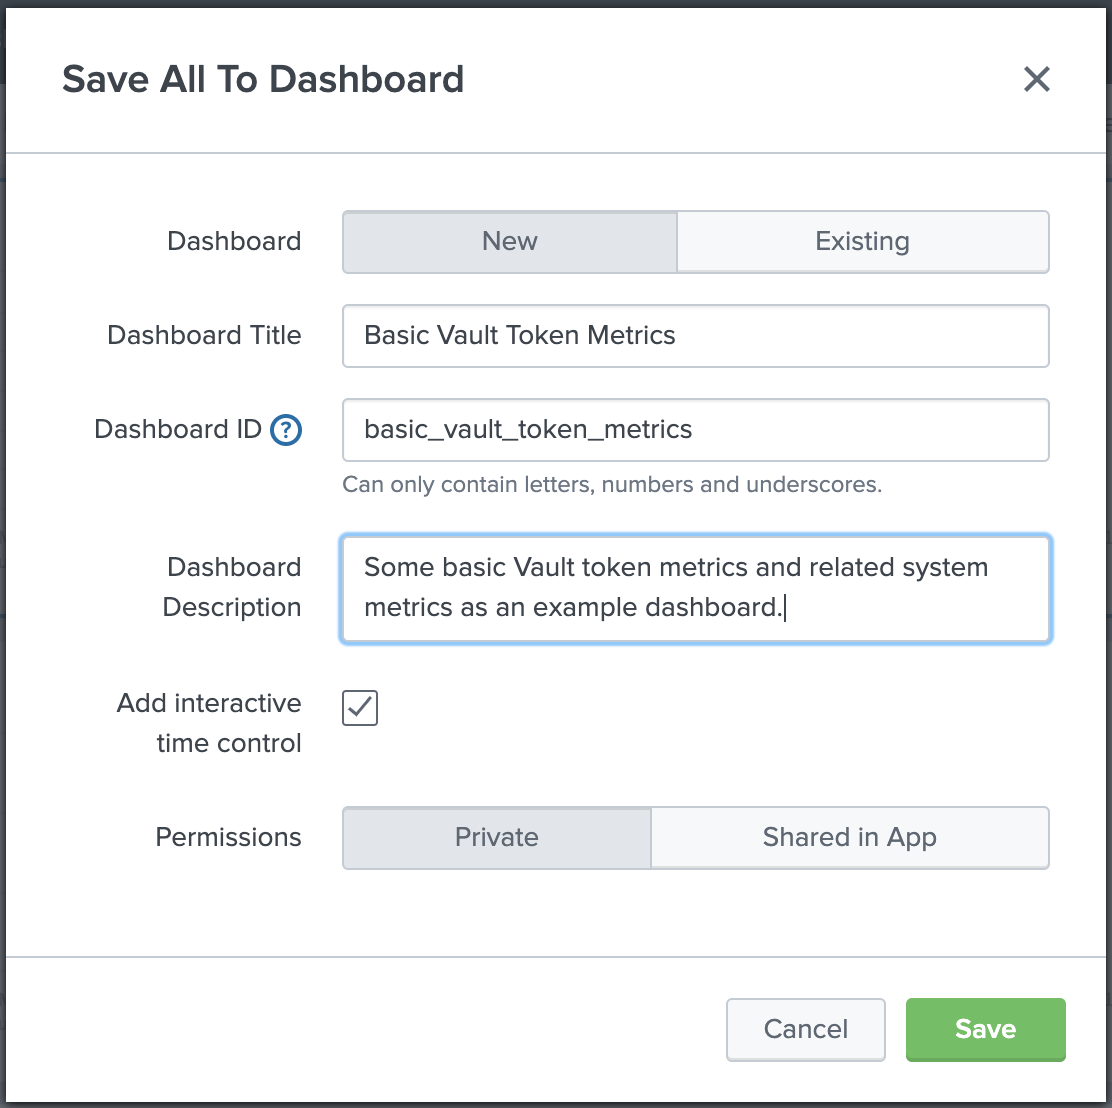
- For Dashboard Title, enter
Basic Vault Metrics. - For Dashboard Description, enter some
Example basic Vault metrics. - Click Save.
- You should observe a dashboard creation dialog.
- Click View Dashboard.
Now, you can edit the dashboard further to arrange it.
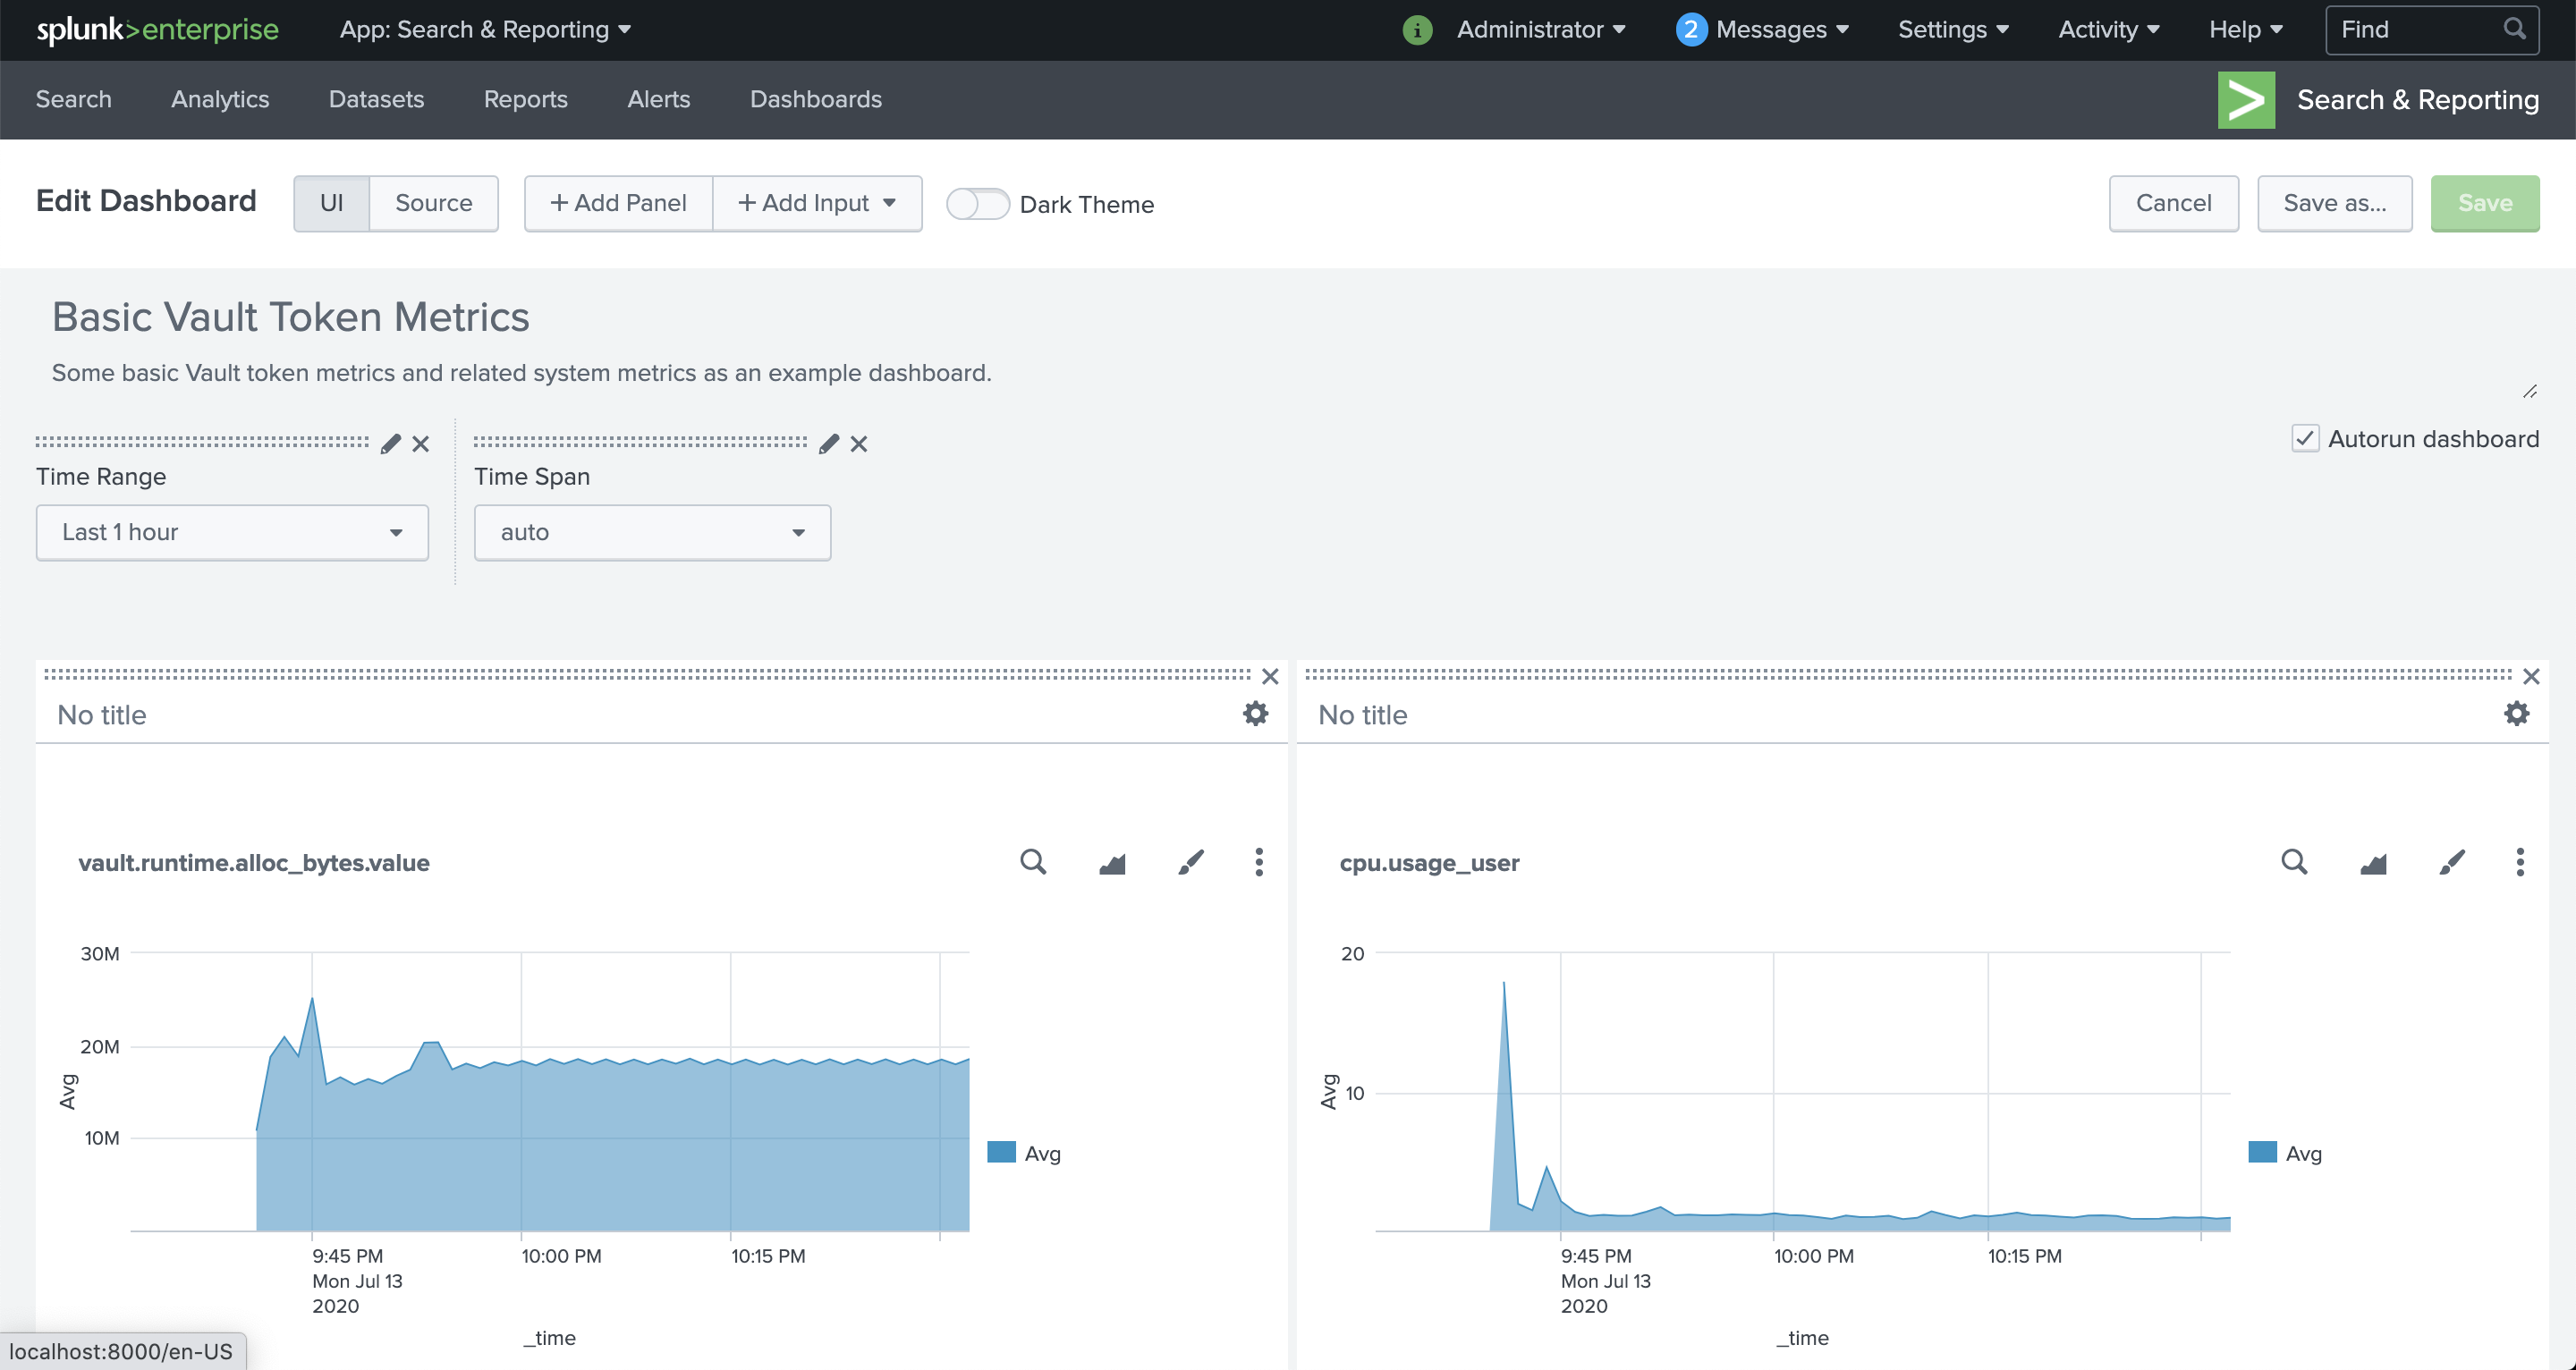
- Click Edit.
- Drag the individual graphs to arrange them; in this example, you arrange them 2 by 2.
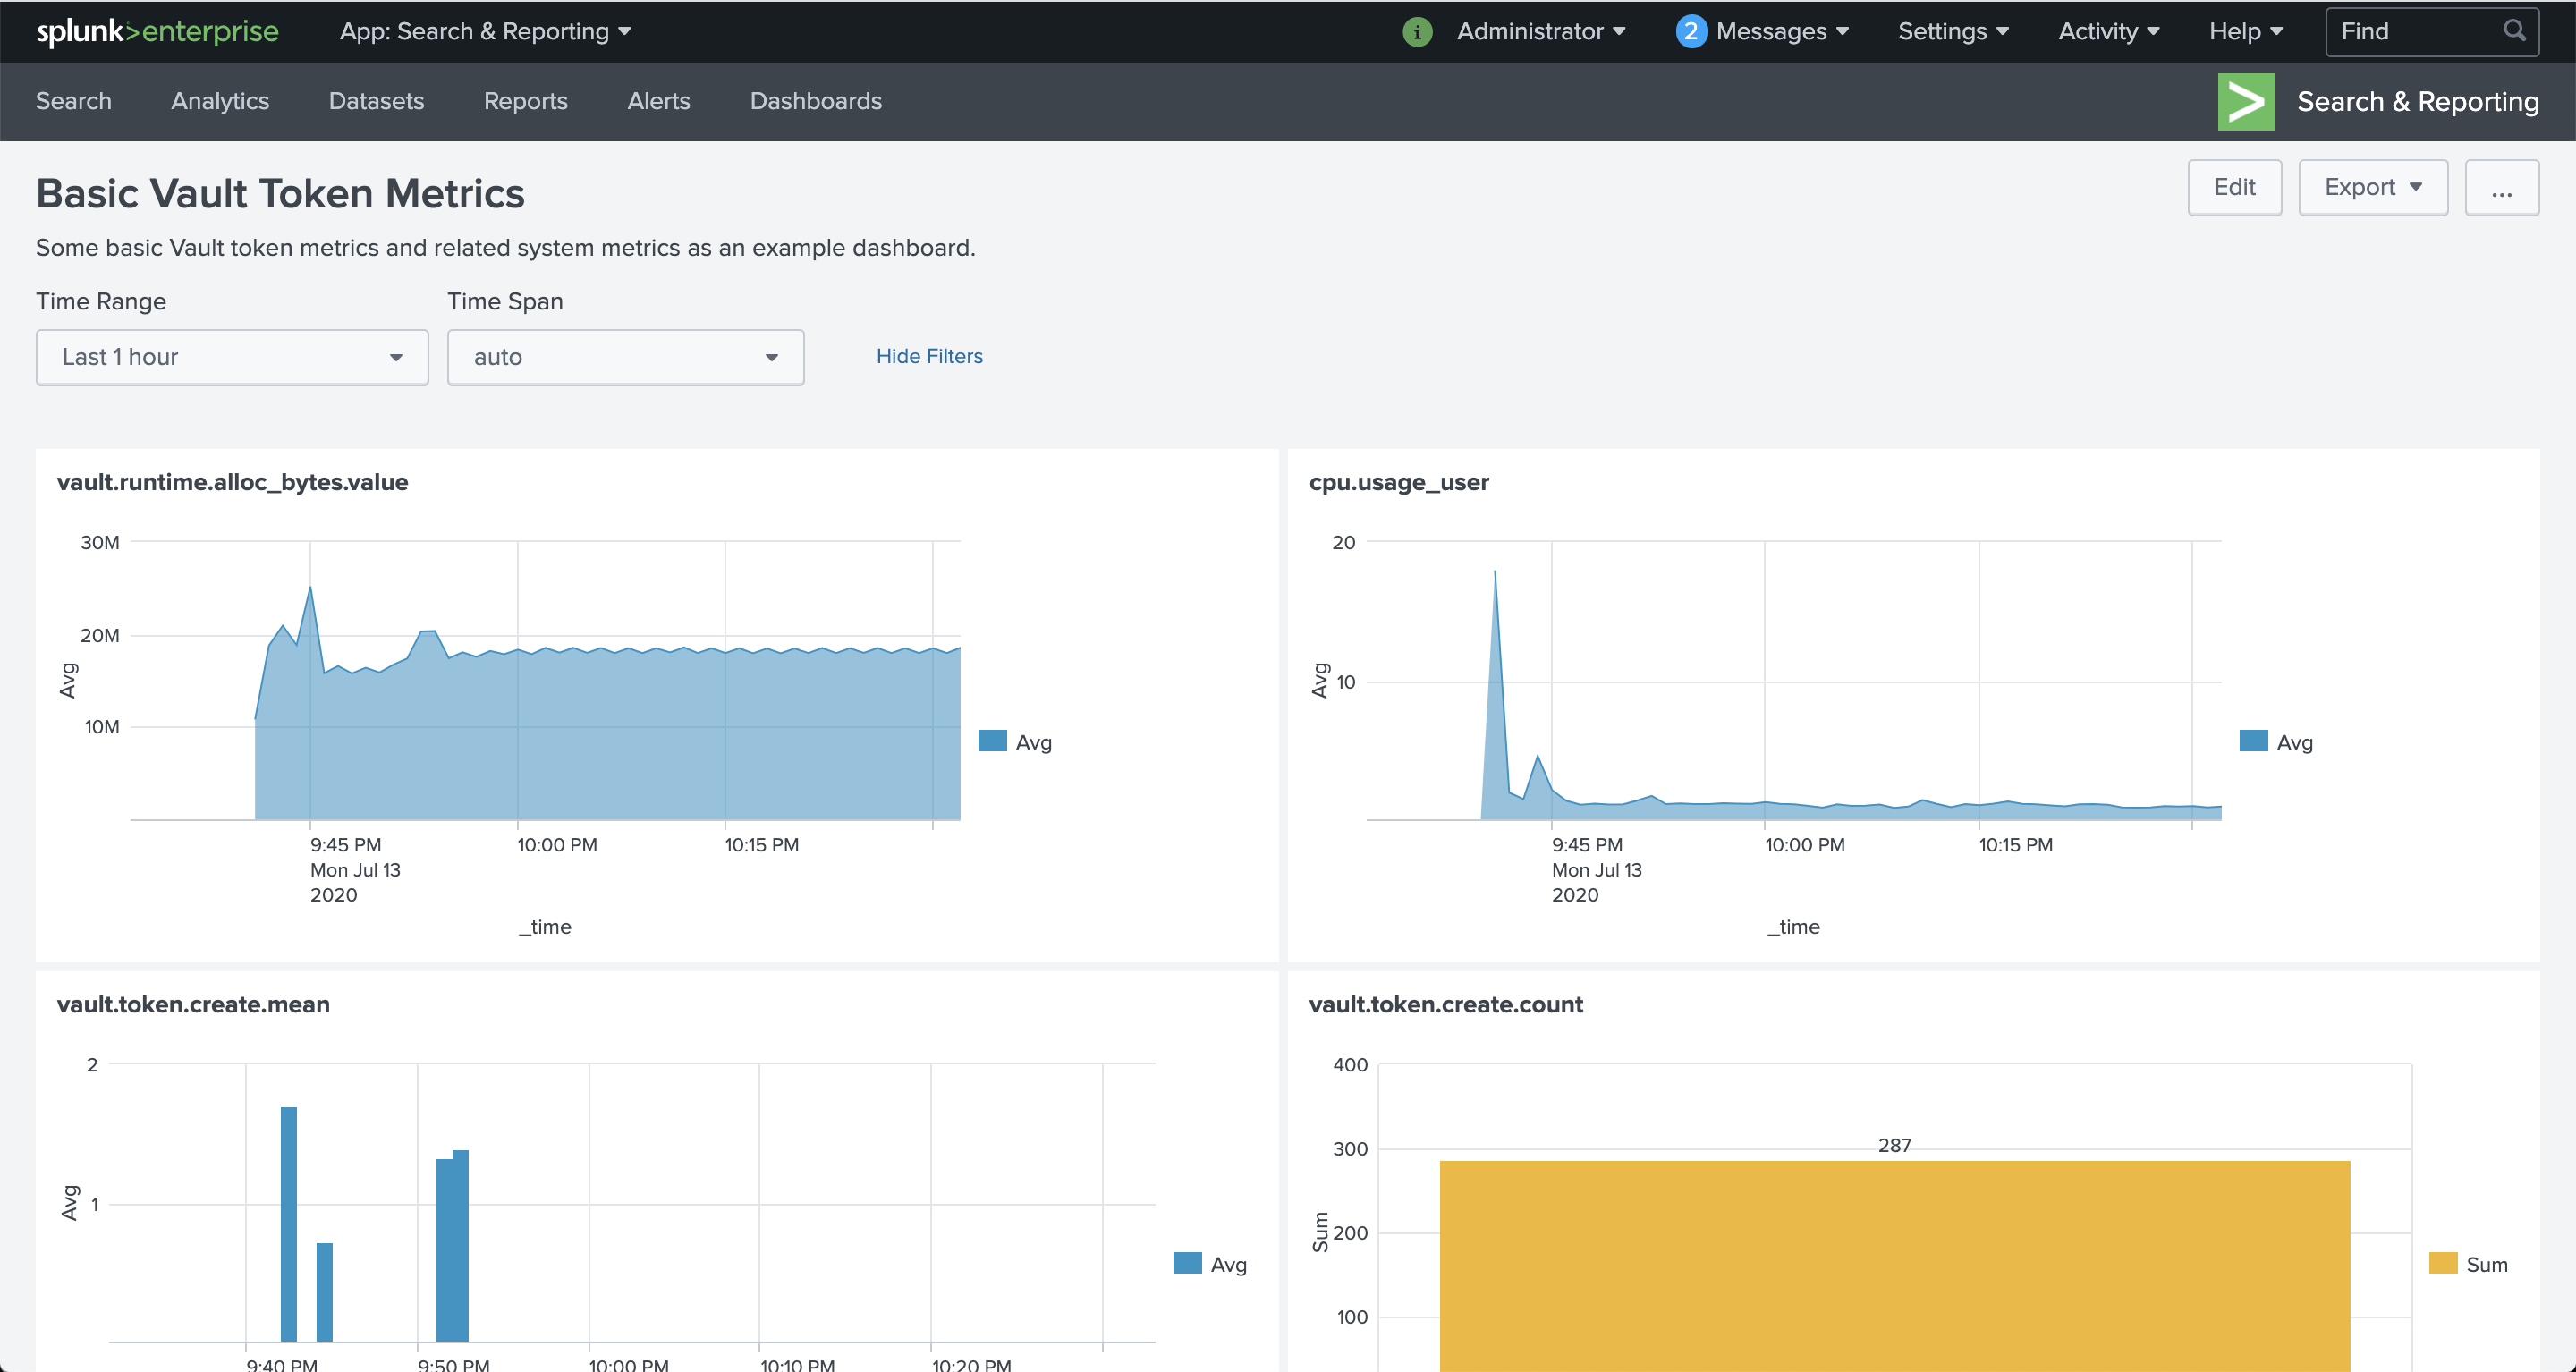
- When you've finished positioning the graphs, click Save.
Here is a screenshot of the final example dashboard.
Splunk app
Vault Enterprise users can take advantage of a complete Splunk app built with care by the HashiCorp product and engineering teams. It includes powerful dashboards that split metrics into logical groupings targets at both operators and business users of Vault. The Splunk application is available with Vault Enterprise Platform. However, all the data sources leveraged by the application are available with all versions of Vault.
Vault Enterprise users can complete the Splunk app request form to request access to the app.
The following are example dashboards and their metrics from the Vault Enterprise Splunk app along with some example queries that you can use with the App.
Vault operations metrics from telemetry dashboard
The operations dashboard combines self-reported data from Vault with information from the Telegraf agent on each host. You can filter to a particular time range, limit your view to a particular cluster, and select any subset of the hosts to display.
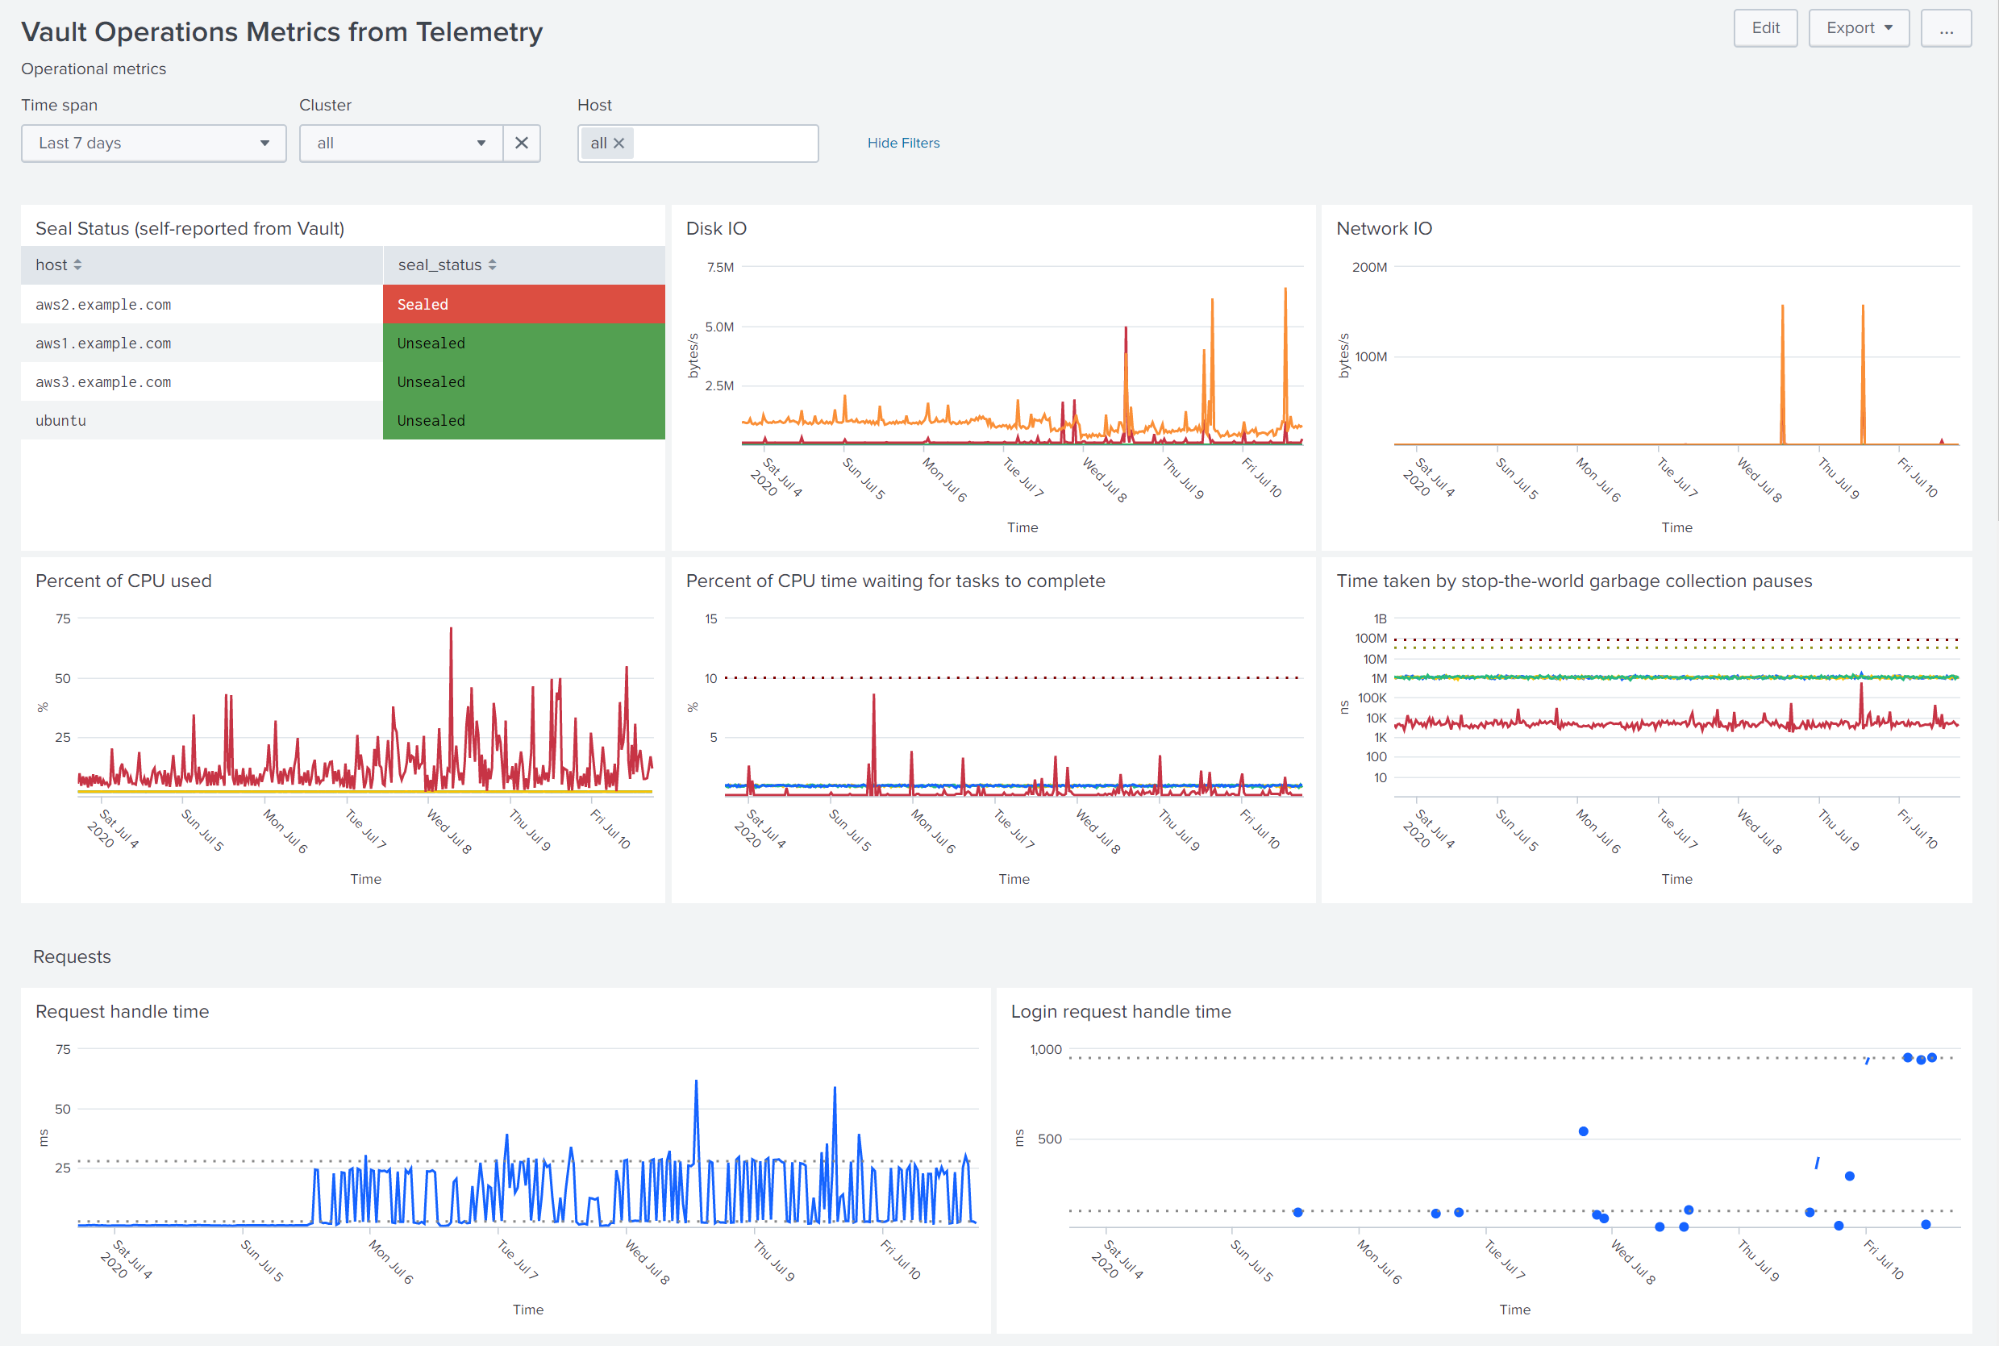
The dashboard shows the seal status of each Vault instance, with sealed instances displayed first. The dashboard lists Disk I/O, Network I/O, and CPU statistics for each selected host (by default all on the same graph). Dotted lines indicate important thresholds or summary statistics.
The next pair of graphs shows request latency, as reported by Vault. The graphs display separate plots for requests to secrets engines and login requests with 50th and 90th percentile shown.
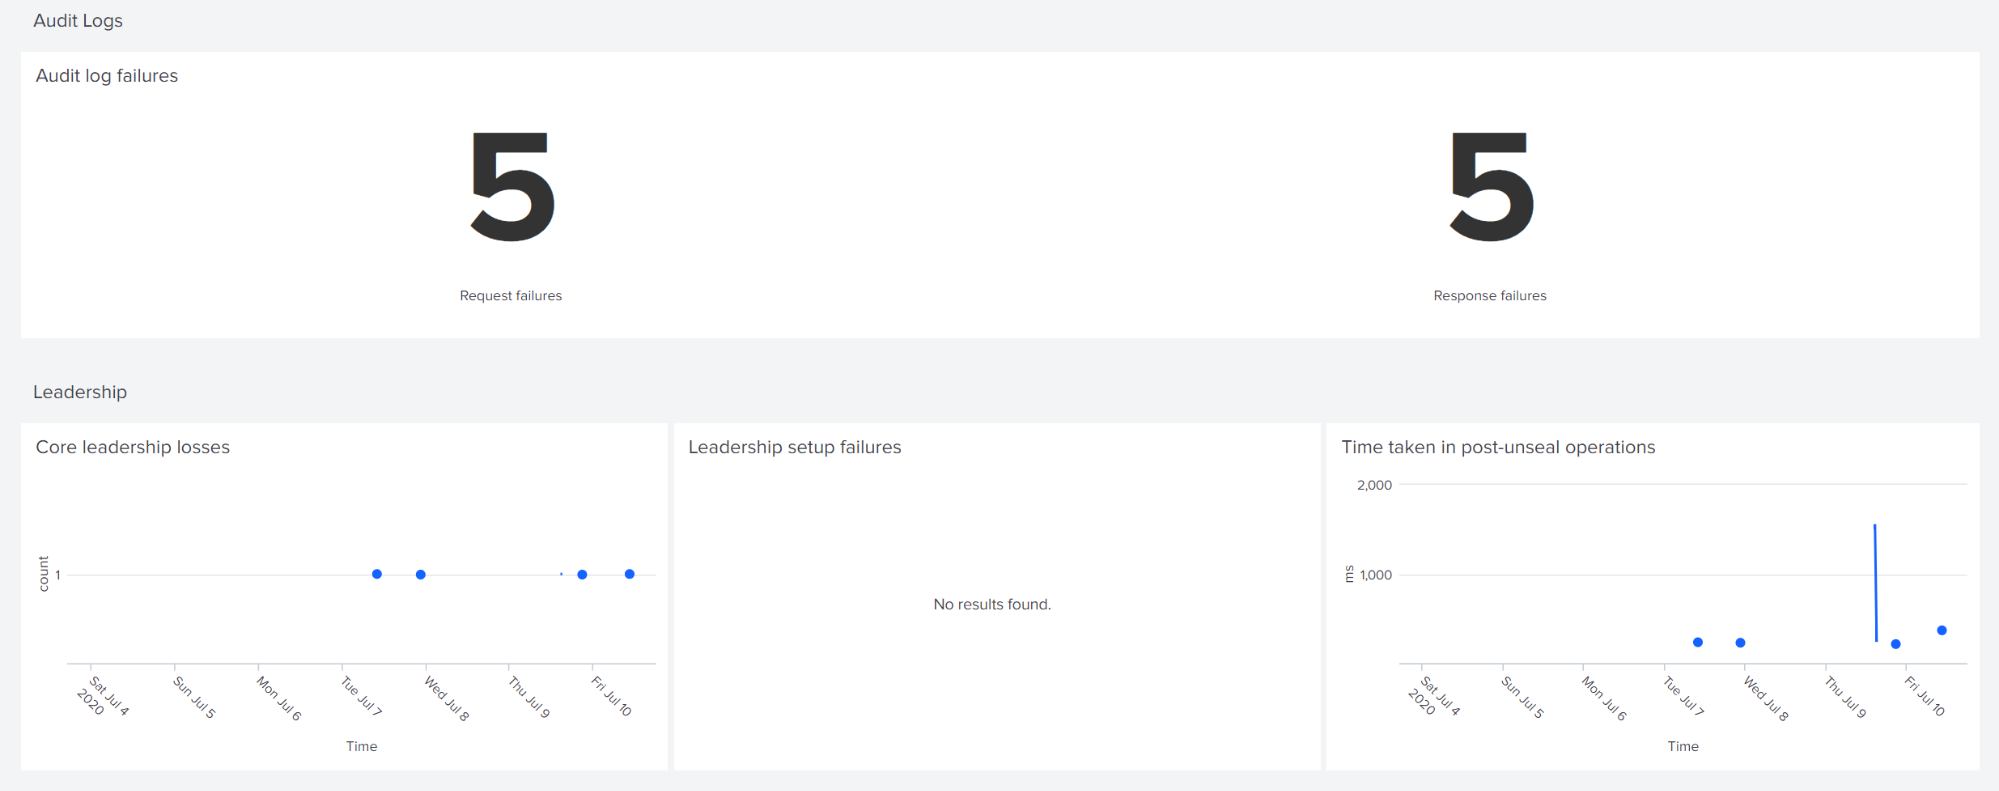
The dashboard counts the total number of audit log failures during the selected time window. In a properly functioning system this value should be zero. The cluster leadership loss time appears here, as well as times of any leadership setup failure.
The next selection reports on memory usage and lease count.
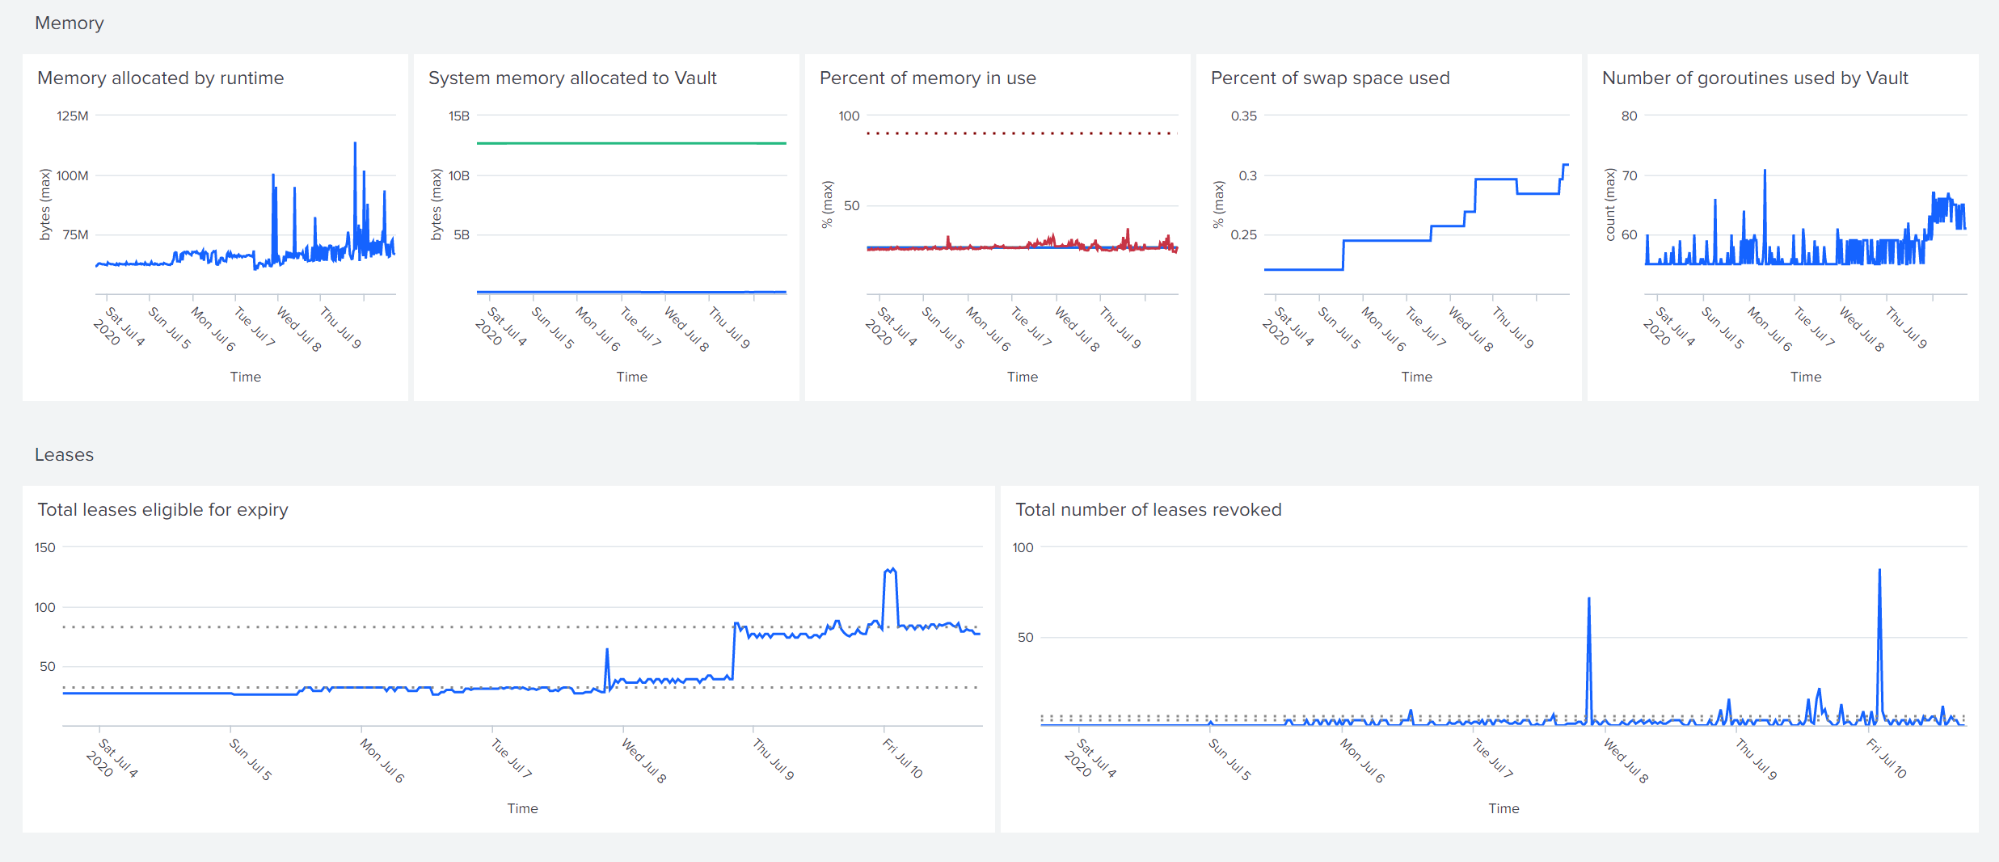
You can investigate sources of high lease counts in the usage dashboard. A high rate of lease revocation can explain some performance problems. The final sections of the dashboard report on Vault's replication and encryption mechanisms.
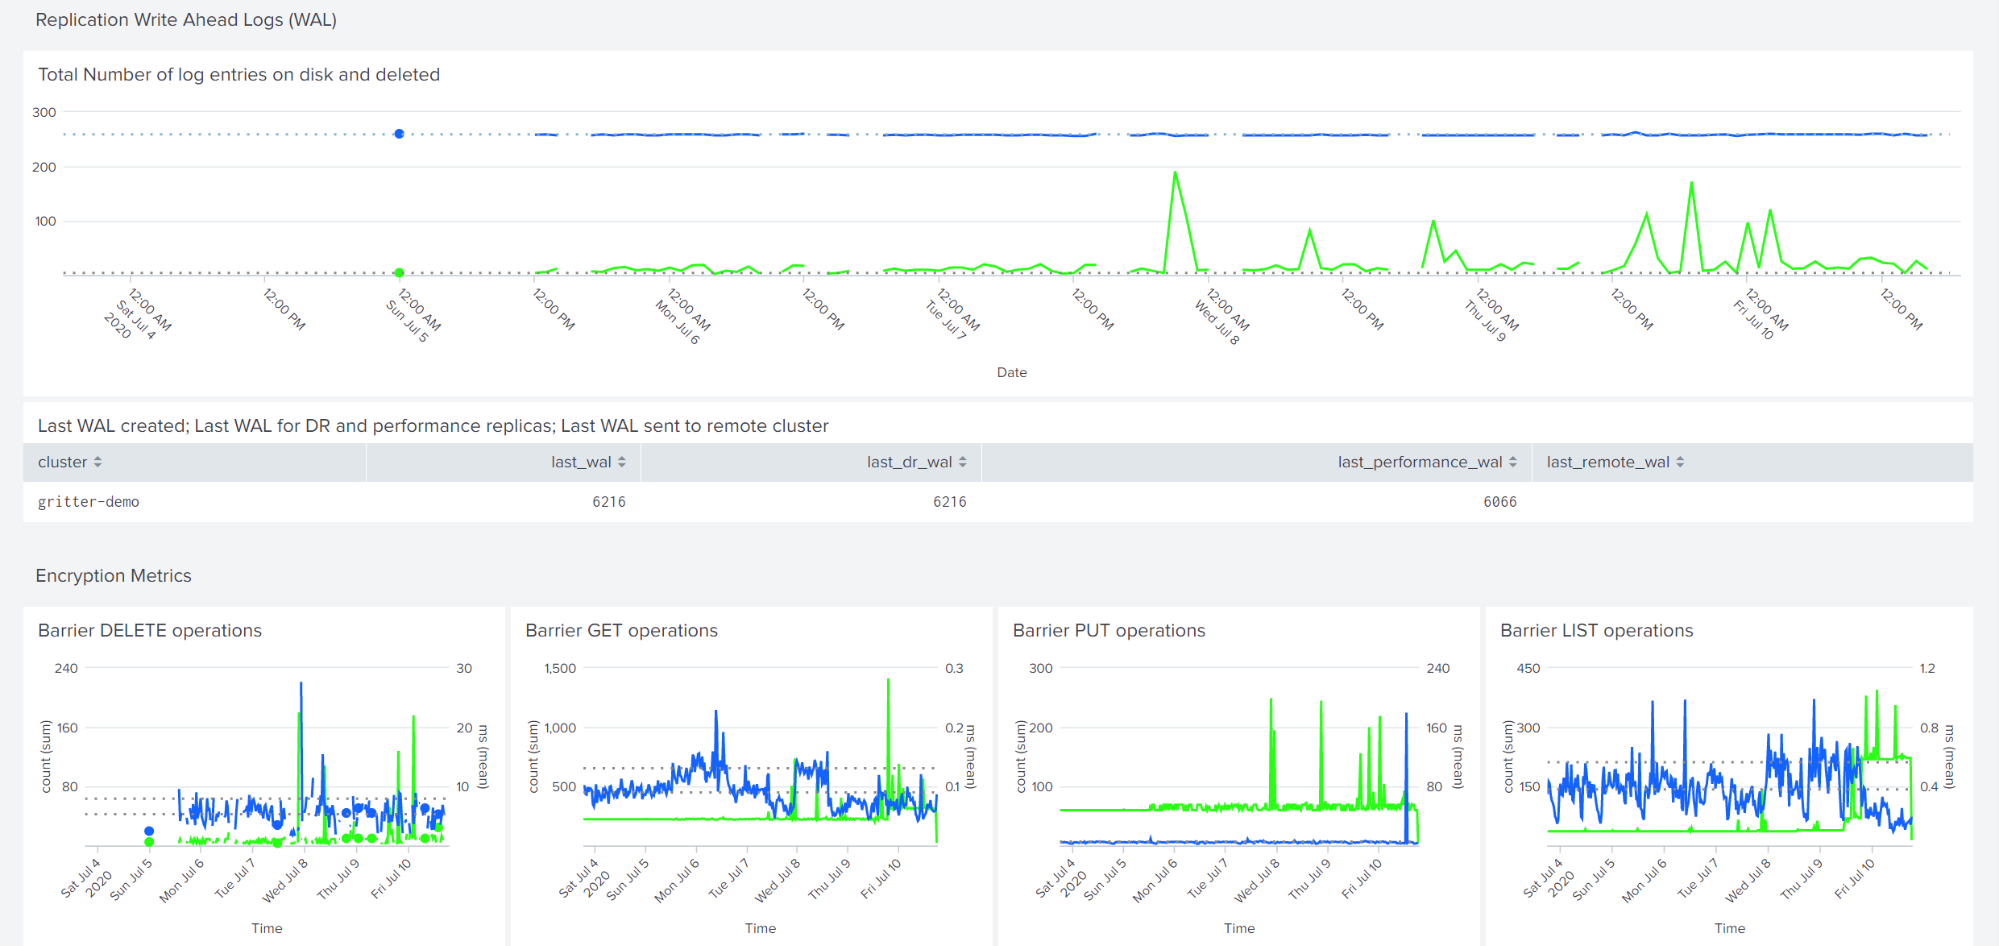
A larger expected number of uncollected write-ahead-log entries might indicate a storage bottleneck. Vault generates these entries even if the cluster is not participating in replication.
The barrier statistics show operations performed at Vault's encryption barrier; the dashboard reports both the count of operations (left axis) and the average latency (right access). Typically, these numbers track the operations at the storage layer and include time spent on the storage operation. Vault can also perform caching or batching to combine or reduce storage operations, so keep this in mind.
Storage metrics from telemetry dashboard
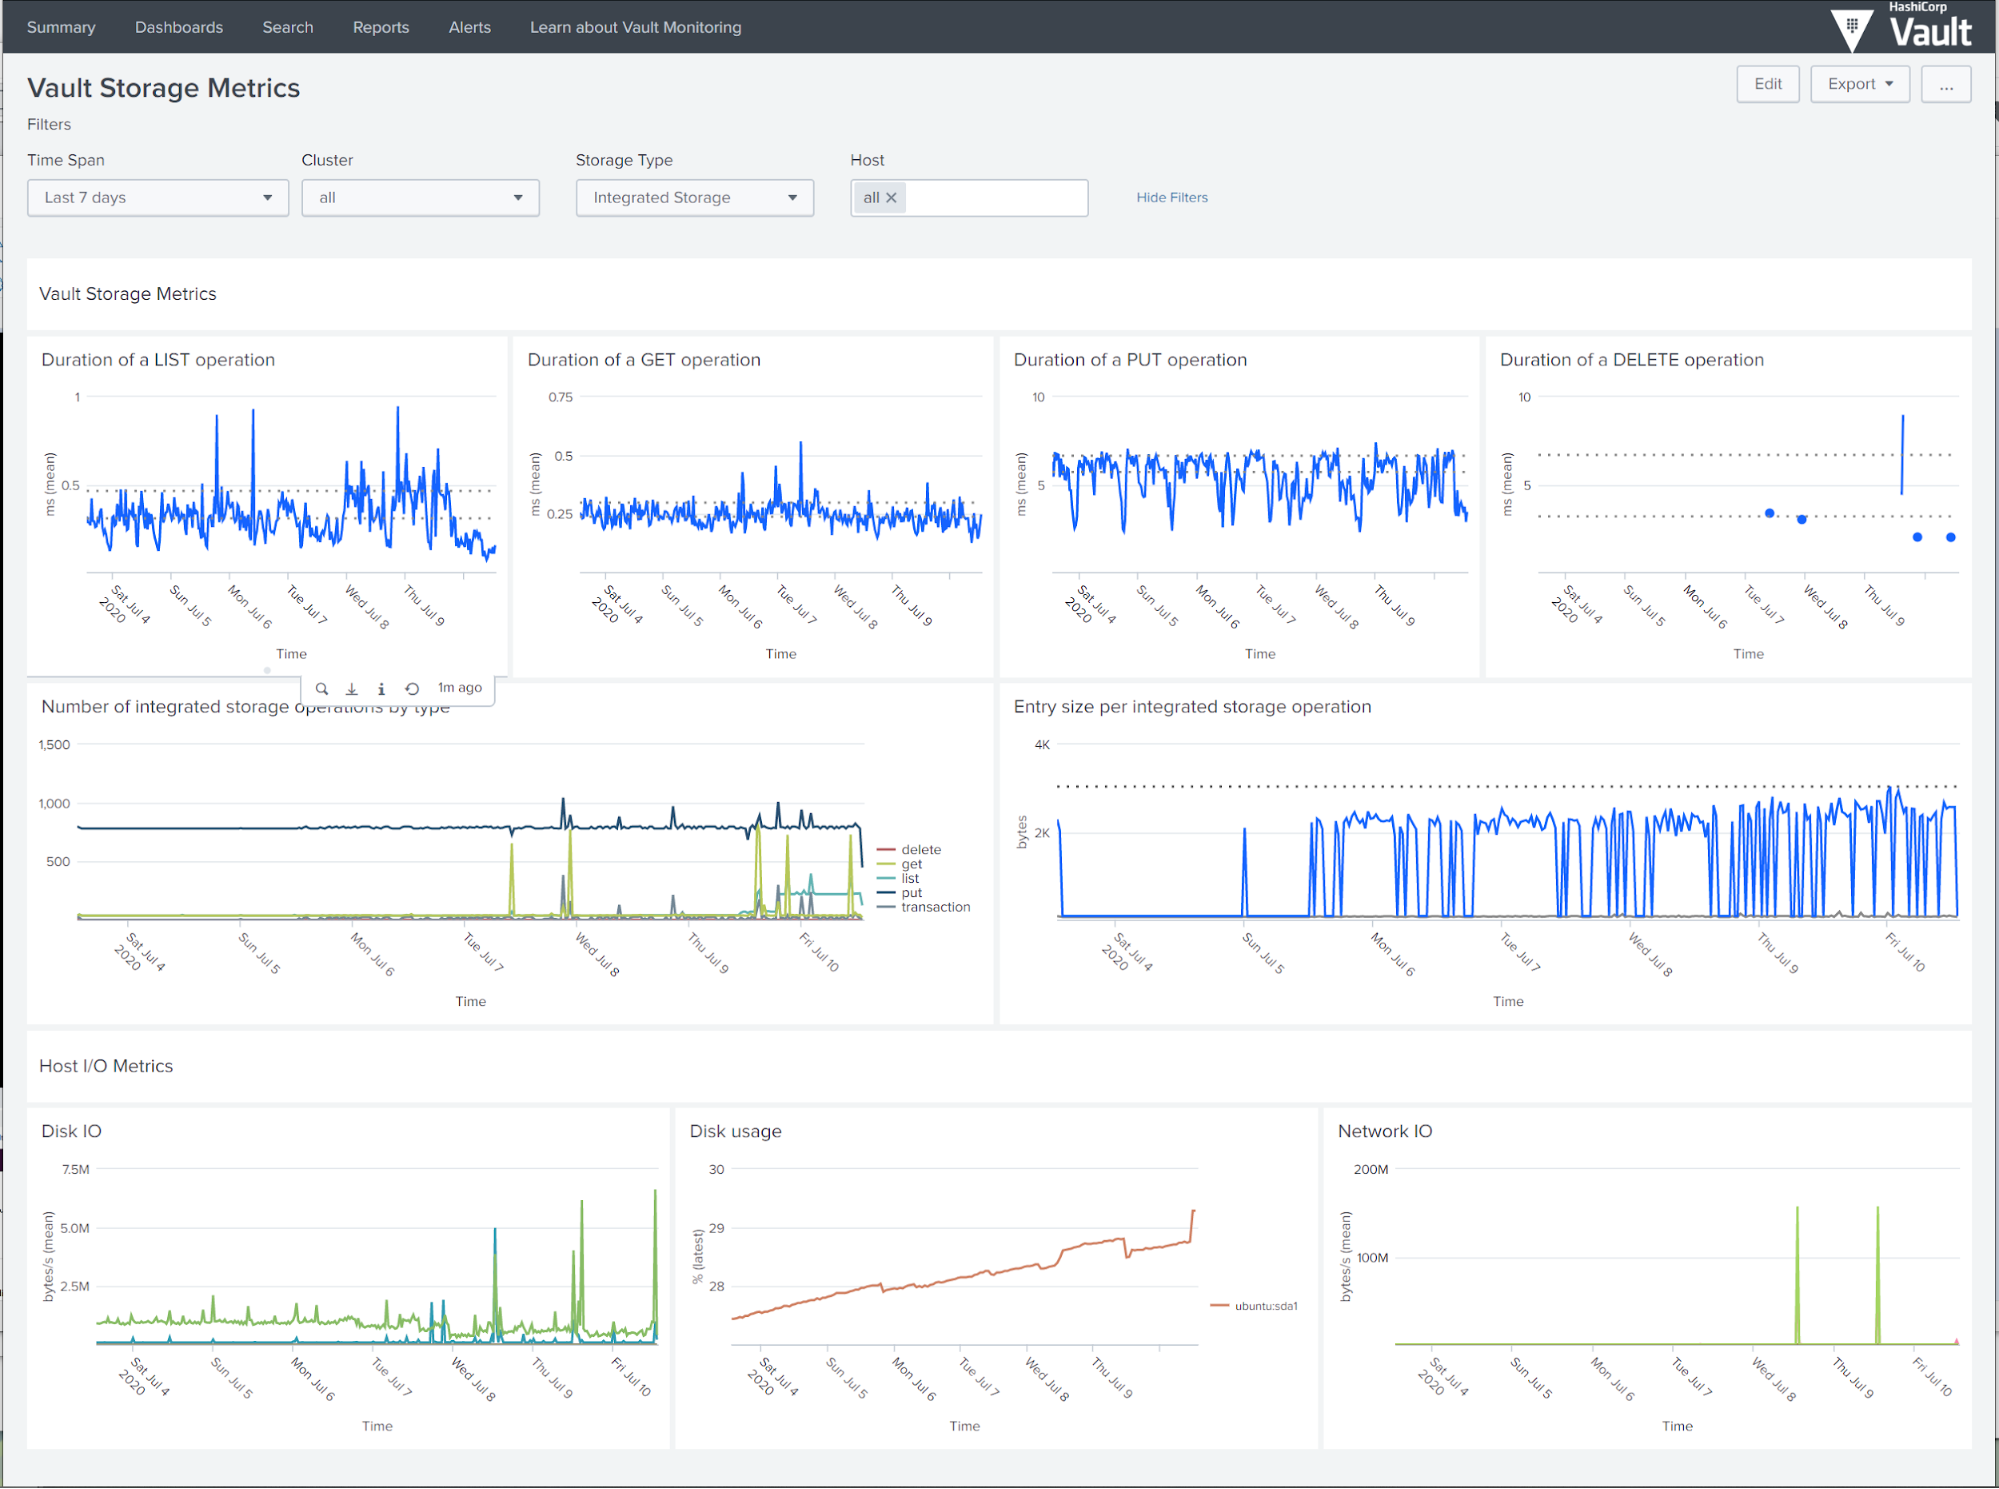
This dashboard shows metrics about the storage type in use. The top row shows measurement of operation latencies, in milliseconds, along with 50th and 90th percentiles.
For Integrated Storage, the next row shows the total count of operations by type, and statistics about storage entry sizes. The dashed line plots the maximum size over the entire window; the blue line represents maximum within each timeframe, and a gray line represents mean entry size. The last row shows host I/O metrics relevant to Integrated Storage: disk I/O throughput, disk usage, and network I/O for each host selected in the drop-down.
Vault usage metrics from telemetry dashboard
The usage metrics page gives information on tokens, secrets, leases, and entities. The top panels let you examine the rate of token creation, and the number of tokens available for use in Vault.
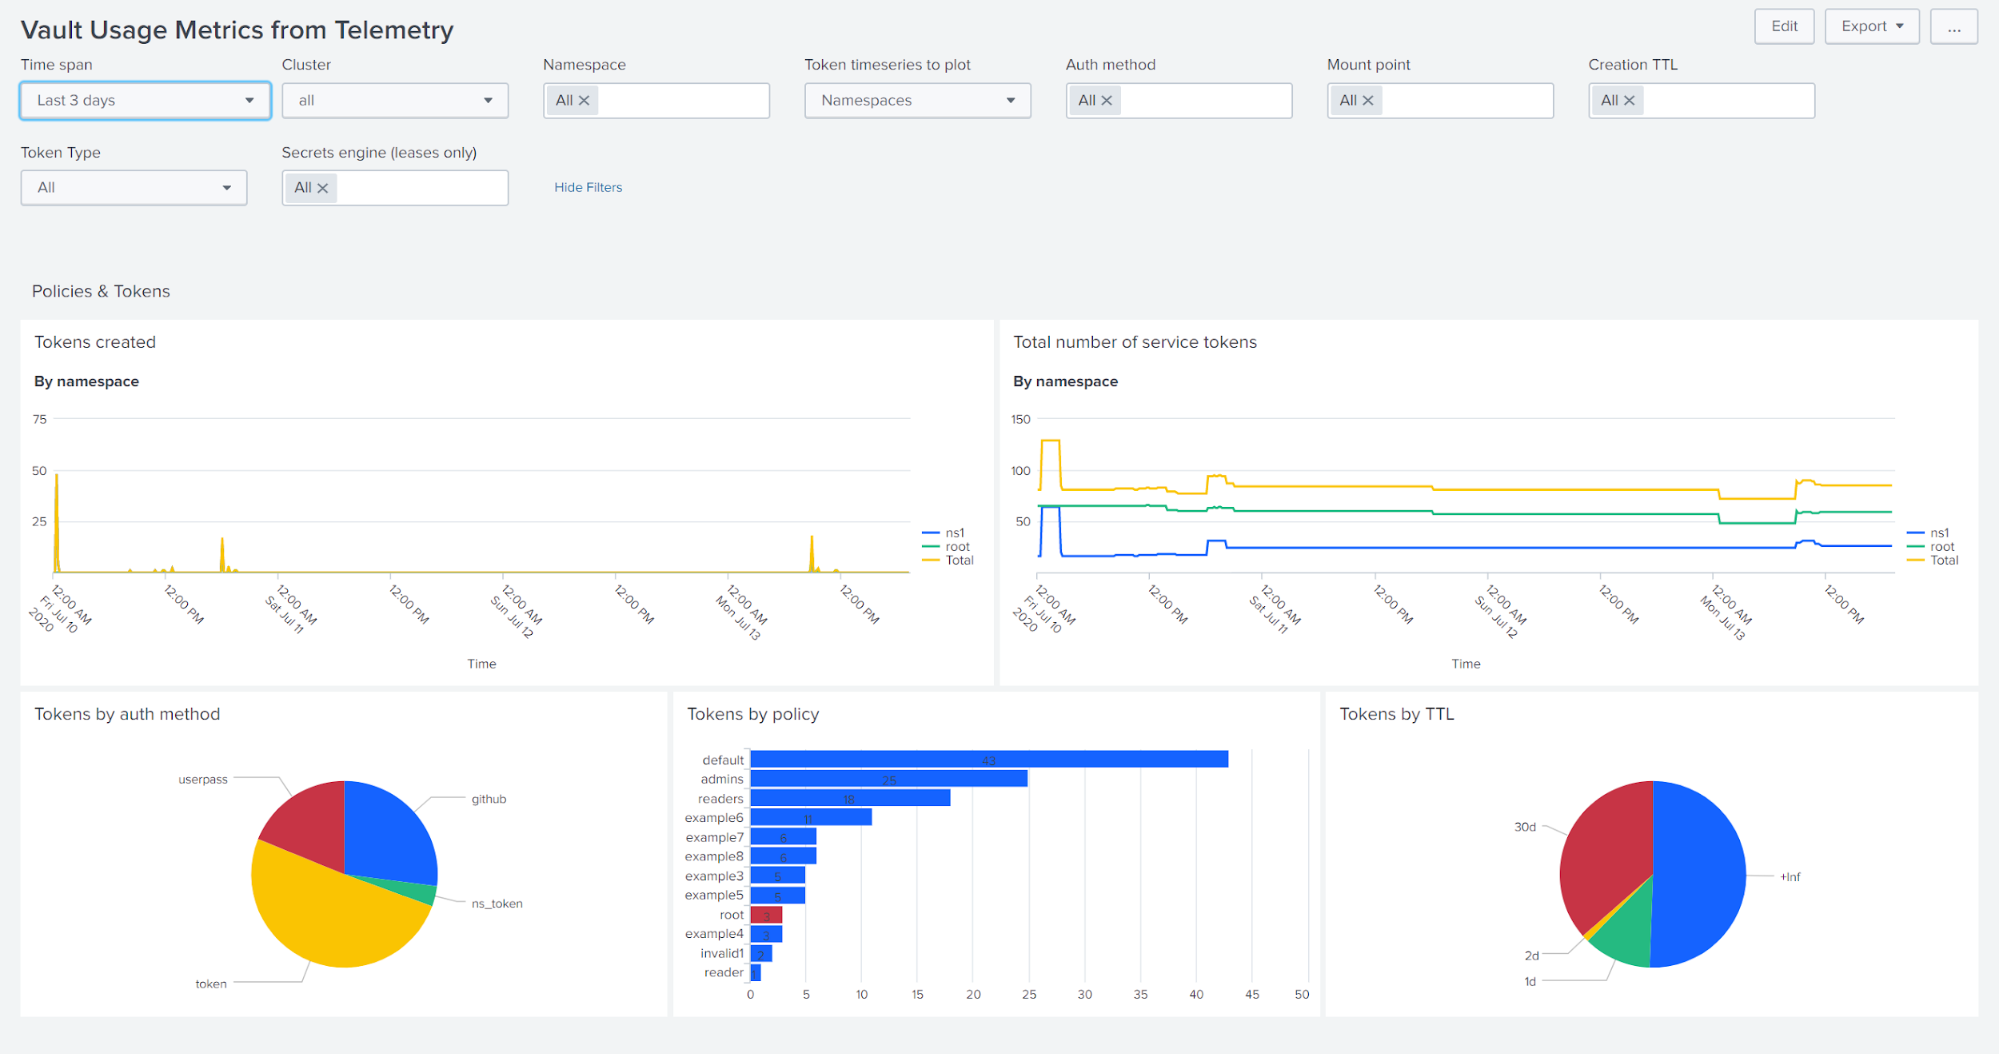
Some combinations of filters are not available and will cause the corresponding panels to disappear. You can change the data series used for the time series plots by selecting "Namespace", "Auth methods", "Mount points", "Policies", or "Creation TTL".
For example, if you select "Mount points", then select "Auth method : github" the graphs will show information specific to any enabled GitHub auth methods.
The next section shows a count of the number of key-value secrets stored in Vault, and the rate of lease creation by mount point. You can filter these by namespace, and filter the lease creation plot by lease TTL or by secrets engine.
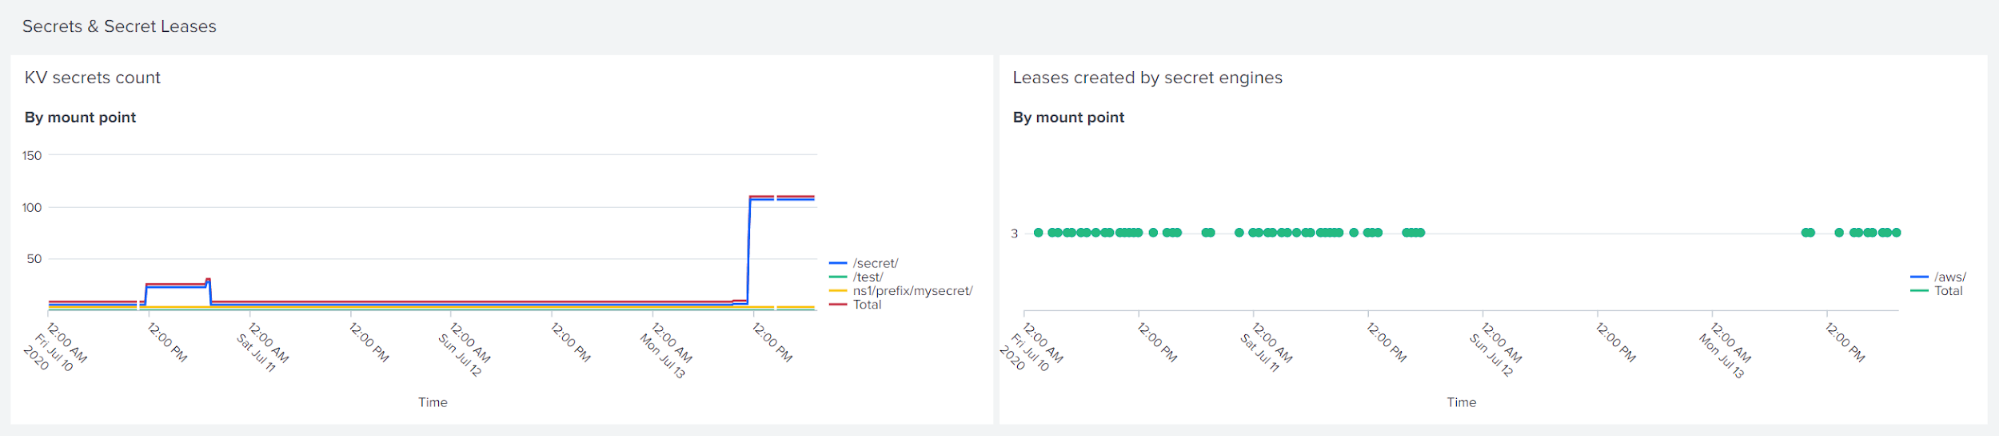
The identity section gives information on which engines create entities, the total count, and the count by alias.

A final section shows the top 15 most common operations, by type and mount point, within the selected time window.
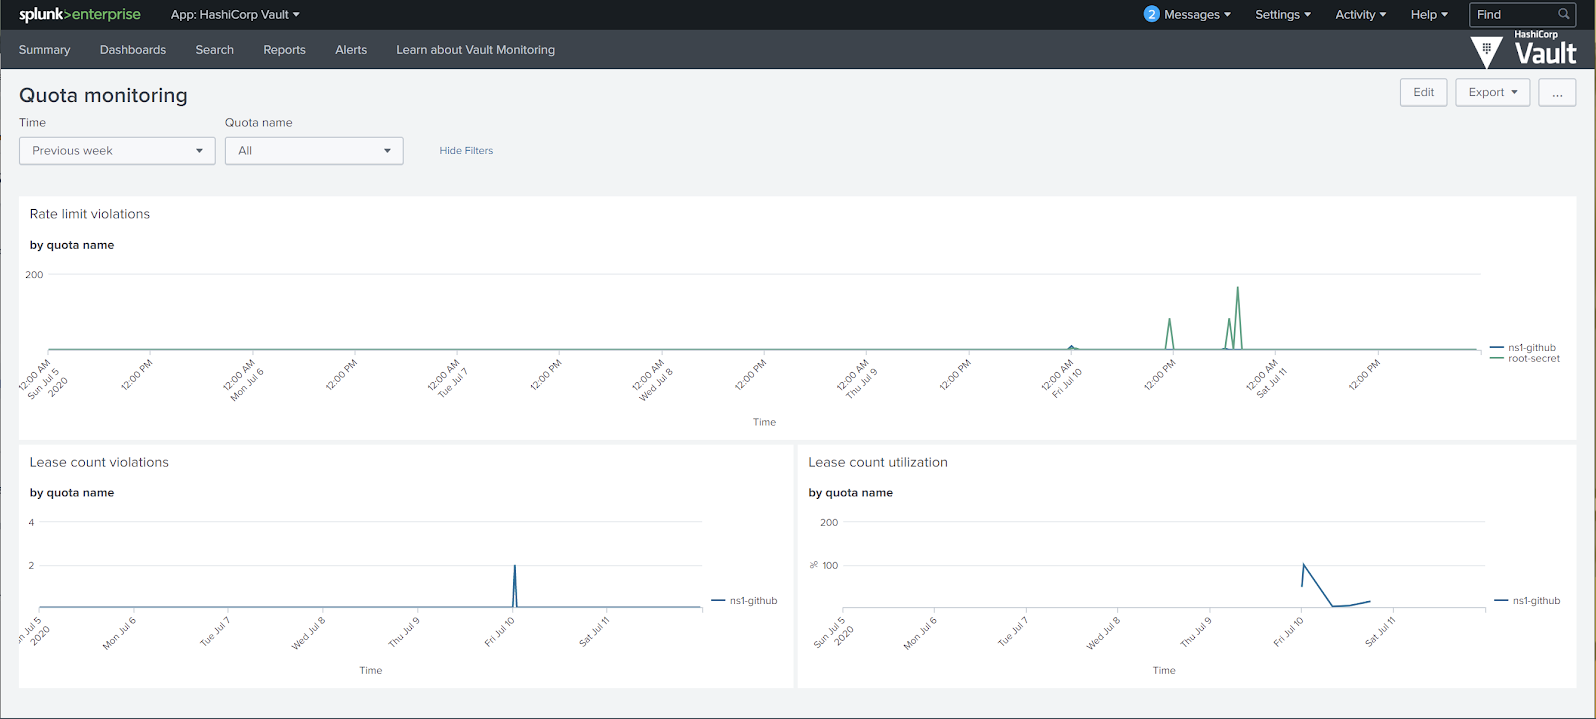
Use case dashboards
The "Quota Monitoring" dashboard plots the vault.quota.rate_limit.violation and vault.quota.lease_count.violation metrics introduced in Vault 1.5 as part of the resource quotas feature. Each lease count quota plots the percentage used. Note that this metric gets emitted upon lease allocation, not upon expiration or revocation.
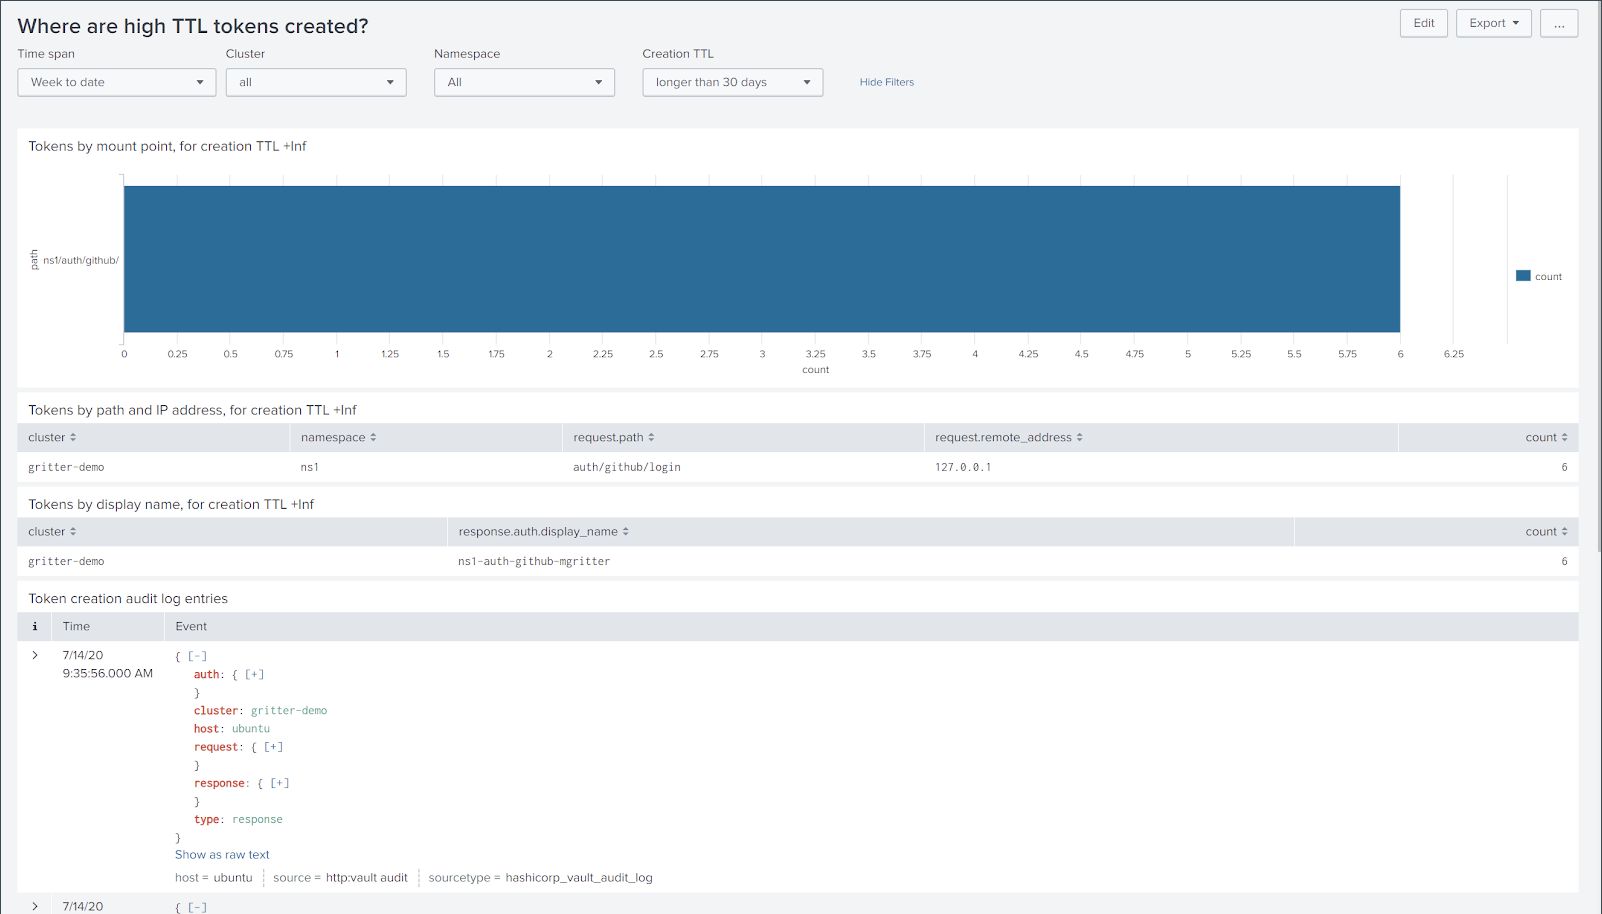
You can use the "Where are high TTL tokens created?" dashboard to identify the sources of long-TTL tokens. The dashboard displays auth methods that have created such tokens (via the vault.token.created metric), and queries the audit log for information such as client IP address and username.
Customizing app dashboards
If you use the Splunk App and would like to customize these dashboards for your own environment, you should clone them rather than editing them in-place.
You can do this from the Dashboards view- select Clone in the Actions drop-down menu to create a copy of the existing dashboard.
This ensures that when a new version of the Splunk App is available, you'll have the latest changes from it.
Example queries for app users
The queries in the Splunk App use a macro to encapsulate the standard parts of a query, such as which index to search and what sourcetype to match. If you have the Splunk App installed, you may use the vault_telemetry alias to limit queries to metrics from Vault and Telegraf that appear in the vault-metrics index.
Another example use case is understanding the number of tokens with policy "admin" in use. As this is a gauge metric, you can't just sum all the values as in the earlier case. Instead, you must take the most recent value of the metric, as in this example:
| mstats latest(vault.token.by_policy) AS count WHERE `vault_telemetry` AND policy=admin BY cluster,namespace earliest=-30m
One subtlety is that the "latest" for a particular combination of labels is not necessarily the same point in time. If a particular policy is no longer used in namespace "ns1" for example, then a "latest" query matching that namespace may return any point during the time window.
Vault multi-dimensional use metrics do not report all possible zero values, because this would create undue load on the metrics collection. The easiest way to handle this time skew is to limit how far back in time the query may go.
Another pitfall to avoid is that in Splunk, metrics are not automatically summed across all possible label sets. If you query for the latest token count gauge matching a policy, that gauge represents just one cluster and one namespace.
Use the BY or WHERE clauses with the entire set of available labels, then sum the resulting values explicitly. For example, you can change the earlier query to return all policy counts across namespaces, like this:
| mstats latest(vault.token.by_policy) AS count WHERE `vault_telemetry` BY cluster,namespace,policy earliest=-30m | stats sum(count) AS count BY policy
| sort -count
The resulting table counts the number of active tokens by policy, summed over all the clusters and namespaces where a token with a matching policy name appears. As before, you can turn this query into a time series by replacing earliest=-30m with span=30m to see the total within each half-hour window.
Here are a couple examples that use just the audit device log data. The following shows all login events, displaying the token display name, entity ID, and the policies attached to the token.
`vault_audit_log` response.auth.accessor=*
| spath output=policies path="response.auth.policies{}"
| table response.auth.display_name, response.auth.entity_id, policies
Next steps
Now that you have configured monitoring for Vault, consider these follow-up tasks:
- Set up resource quotas and monitor quota violations - Configure rate limiting and lease count quotas, then track violations using the monitoring stack
- Analyze audit logs for security investigations - Use the audit device data for compliance reporting and security incident response
- Review the complete telemetry metrics reference - Explore all available Vault metrics with detailed descriptions and measurement types
- Configure Prometheus integration for metrics collection - Set up an alternative metrics collection approach using Prometheus
- Understand Enterprise namespace metrics - Learn how to monitor multi-tenant Vault deployments
For more monitoring and operations tutorials, visit the Vault monitoring tutorials.
Summary
You learned about two sources of Vault operational and usage data in the form of telemetry metrics and audit device logs. You also got to know some critical usage and operational metrics along with how to use them in a specific monitoring and graphing stack.
You also learned about a solution consisting of Fluent Bit and Splunk for analyzing and monitoring Vault, and about the Vault Enterprise Splunk app.
Resources
Vault monitoring documentation
- Vault telemetry metrics reference - Complete list of available metrics with types and descriptions
- Vault audit devices overview - Configure and manage audit logging for compliance
- Telemetry configuration reference - All telemetry stanza options and settings
- Vault /sys/metrics HTTP API - Programmatic access to Vault metrics
Splunk integration
- Splunk HTTP Event Collector guide - Configure HEC for data ingestion
- Create Events Indexes - Set up event storage for audit logs
- Create Metrics indexes - Optimize metrics storage in Splunk
Fluent Bit documentation
- Fluent Bit documentation - Complete reference for Fluent Bit configuration
- Fluent Bit statsd input - Configure statsd for Vault metrics
- Fluent Bit Splunk output - Send data to Splunk HEC
Audit filtering
- Filter concepts documentation - Understand how to customize audit output
- Filter audit entries documentation - Apply filters to audit device logs
- Audit filter API documentation - Programmatically configure audit filters
- Audit filter CLI documentation - Enable audit filters from the command line
Enterprise features
- Vault Enterprise namespaces - Multi-tenant metrics and audit isolation
- Explore the go-metrics library that powers Vault telemetry - Understand the underlying metrics collection framework