Collect Terraform Enterprise metrics with Prometheus and Grafana
Terraform Enterprise is critical infrastructure for many businesses. You can proactively monitor your Terraform Enterprise instance's performance by enabling its built-in metrics endpoint and connecting it to your monitoring system. These steps will help you prevent issues and outages, which can be disruptive and costly.
The metrics provided by Terraform Enterprise let you identify which worker containers exist at any given time, monitor their performance in order to troubleshoot and prevent run issues, and make informed run concurrency and capacity constraint decisions.
In this tutorial you will enable usage-metric collection in Terraform Enterprise and provision an instance running Prometheus and Grafana. Then you will configure Prometheus to scrape metrics from your Terraform Enterprise deployment and visualize them on a Grafana dashboard.
Prerequisites
This tutorial assumes that you are familiar with Terraform Enterprise and the standard Terraform workflow. If you are new to Terraform, complete the Get Started tutorials first. If you are new to Terraform Enterprise, read the Terraform Enterprise documentation first.
For this tutorial, you will need:
- An existing Terraform Enterprise deployment in standalone mode in AWS, running version 202207-1 or newer, with ports
9090and9091available. You will also need administrator access to your Terraform Enterprise dashboard. - The Terraform CLI (1.1.0+) installed.
- An AWS account with credentials set as local environment variables.
Enable TFE metrics endpoint
Log in to the Replicated dashboard of your TFE instance at https://<TFE_HOSTNAME>:8800.
Open the Settings page, and click on Metrics.
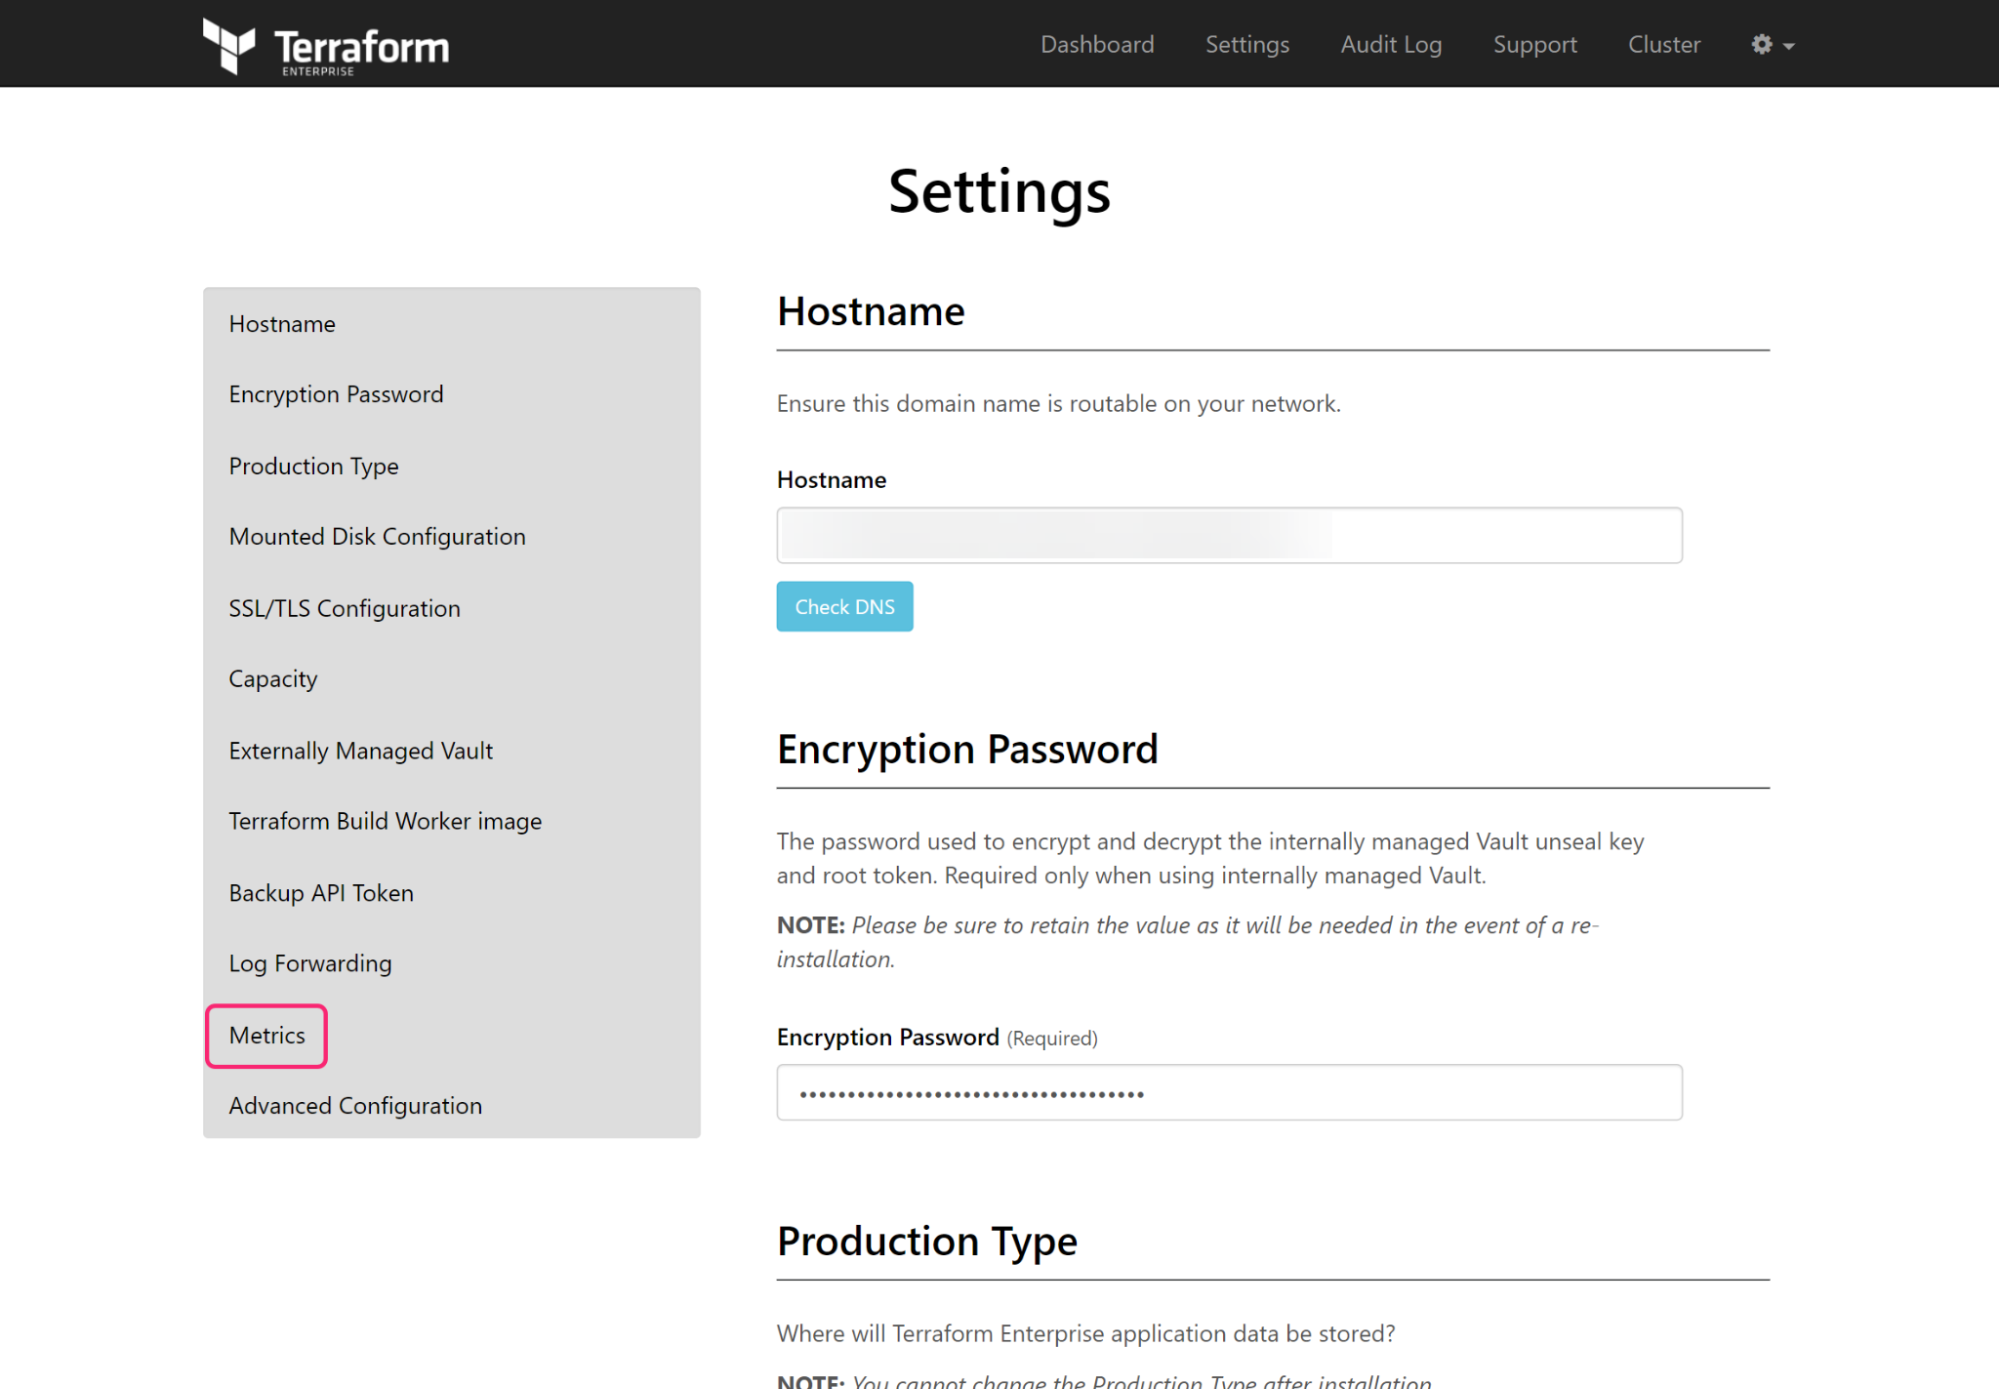
Click Enable Metrics Endpoint. Leave the default port settings set to 9090 and 9091 for HTTP and HTTPS respectively. In this tutorial, you will only use port 9090.
Scroll down to the bottom of the settings page and click on the Save button. Then, click on Restart Now to restart Terraform Enterprise and apply the settings.
Clone the example repository
Clone the example code repository, which you will use to deploy demonstration instances of Prometheus and Grafana.
$ git clone https://github.com/hashicorp-education/learn-terraform-enterprise-metrics-prometheus
The configuration in this repository deploys a demonstration instance running both Prometheus and Grafana.
Navigate to the cloned repository.
$ cd learn-terraform-enterprise-metrics-prometheus
Review configuration
Open main.tf, which configures AWS resources for your Prometheus and Grafana deployment, including:
- an AWS security group
- an IAM role and role policy
- instance profile
- an EC2 instance
The prometheus security group lets your browser connect to the instance on port 80 and 443, and Grafana and Prometheus to connect on ports 9090 and 3000.
main.tf
resource "aws_security_group" "prometheus" {
  name        = "prometheus"
  description = "Learn tutorial Security Group for prometheus instance"

  ingress {
    description = "Allow port 9090 inbound"
    from_port   = 9090
    to_port     = 9090
    protocol    = "tcp"
    cidr_blocks = ["0.0.0.0/0"]
  }

  ingress {
    description = "Allow port 3000 inbound"
    from_port   = 3000
    to_port     = 3000
    protocol    = "tcp"
    cidr_blocks = ["0.0.0.0/0"]
  }

  ingress {
    description = "Allow port 80 inbound"
    from_port   = 80
    to_port     = 80
    protocol    = "tcp"
    cidr_blocks = ["0.0.0.0/0"]
  }

  ingress {
    description = "Allow port 443 inbound"
    from_port   = 443
    to_port     = 443
    protocol    = "tcp"
    cidr_blocks = ["0.0.0.0/0"]
  }

  egress {
    description = "Allow port 9090 outbound"
    from_port   = 9090
    to_port     = 9090
    protocol    = "tcp"
    cidr_blocks = ["0.0.0.0/0"]
  }

  egress {
    description = "Allow port 3000 outbound"
    from_port   = 3000
    to_port     = 3000
    protocol    = "tcp"
    cidr_blocks = ["0.0.0.0/0"]
  }

  egress {
    description = "Allow port 80 outbound"
    from_port   = 80
    to_port     = 80
    protocol    = "tcp"
    cidr_blocks = ["0.0.0.0/0"]
  }

  egress {
    description = "Allow port 443 outbound"
    from_port   = 443
    to_port     = 443
    protocol    = "tcp"
    cidr_blocks = ["0.0.0.0/0"]
  }
}
Next, the configuration defines an IAM role, role policy, and instance profile which grant AmazonEC2ReadOnlyAccess permissions to the Prometheus instance. This will let the Prometheus EC2 instance use the AWS API to find your Terraform Enterprise EC2 instance without needing your AWS credentials.
First the configuration creates the IAM role resource, because the IAM instance profile depends on the role.
main.tf
resource "aws_iam_role" "prometheus_aws_iam_role" {
  name = "prometheus_aws_iam_role"

  assume_role_policy = <<EOF
{
   "Version": "2012-10-17",
   "Statement": [
     {
       "Action": "sts:AssumeRole",
       "Principal": {
         "Service": "ec2.amazonaws.com"
       },
       "Effect": "Allow",
       "Sid": ""
     }
   ]
 }
 EOF
}
Next the configuration creates the IAM instance profile and associates it with the IAM role.
main.tf
resource "aws_iam_instance_profile" "prometheus_iam_instance_profile" {
  name = "prometheus_iam_instance_profile"
  role = aws_iam_role.prometheus_aws_iam_role.name
}
main.tf
resource "aws_iam_role_policy" "prometheus_iam_role_policy" {
  name = "prometheus_iam_role_policy"
  role = aws_iam_role.prometheus_aws_iam_role.id

  policy = <<EOF
{
    "Version": "2012-10-17",
    "Statement": [
        {
            "Effect": "Allow",
            "Action": "ec2:Describe*",
            "Resource": "*"
        },
        {
            "Effect": "Allow",
            "Action": "elasticloadbalancing:Describe*",
            "Resource": "*"
        },
        {
            "Effect": "Allow",
            "Action": [
                "cloudwatch:ListMetrics",
                "cloudwatch:GetMetricStatistics",
                "cloudwatch:Describe*"
            ],
            "Resource": "*"
        },
        {
            "Effect": "Allow",
            "Action": "autoscaling:Describe*",
            "Resource": "*"
        }
    ]
}
 EOF
}
Next, the configuration defines an EC2 instance that will host the Prometheus and Grafana applications.
main.tf
resource "aws_instance" "prometheus_instance" {
  ami                    = data.aws_ami.amazon_linux.id
  instance_type          = "t2.micro"
  vpc_security_group_ids = [aws_security_group.prometheus.id]
  subnet_id              = data.aws_instance.get_existing_tfe_subnet_id.subnet_id
  iam_instance_profile   = aws_iam_instance_profile.prometheus_iam_instance_profile.name
  user_data              = templatefile("prometheus-install.sh.tftpl", { tfe_tag_name = var.tfe_tag_name, aws_region = var.aws_region })
  tags = {
    "Name" = "prometheus_instance"
  }
}
Notice that the iam_instance_profile attribute grants this instance read-only access to the AWS API, as defined in the IAM role policy. The user_data attribute uses the templatefile() function and template variables to generate a script that installs Prometheus and Grafana.
Now open prometheus-install.sh.tftpl, which is a Terraform template for a script that will run when the EC2 instance boots. The script downloads, configures, and starts Prometheus and Grafana.
Review the portion of the script that generates a Prometheus configuration file.
prometheus-install.sh.tftpl
sudo cat > /etc/prometheus/prometheus.yml << "EOF"
global:
  scrape_interval: 10s

scrape_configs:
  - job_name: tfe
    params:
      format:
        - prometheus
    relabel_configs:
    - source_labels: [__meta_ec2_instance_id]
      regex: (.*)
      target_label: instance
      replacement: ${1}
      action: replace
    ec2_sd_configs:
    - endpoint: ""
      region: ${aws_region}
      refresh_interval: 1m
      port: 9090
      filters:
        - name: tag:Name
          values:
            - ${tfe_tag_name}
EOF
##...
The scrape configuration file contains the Prometheus job_name for the Terraform Enterprise scrape target. The ec2_sd_configs block identifies the Terraform Enterprise instance in the correct region while filtering on the Name tag value.
The script configuration is intended only for demonstration environments which do not have a Prometheus and Grafana deployment. Your existing Prometheus instance may require alternative configuration options, which you can review in the Prometheus configuration documentation.
Set input variables
Open terraform.tfvars in your code editor, and update its values:
- Set
aws_regionto the same region as your existing Terraform Enterprise instance. Prometheus will search for your Terraform Enterprise instance within the specified region. - Set
tfe_tag_nameto the name tag of your Terraform Enterprise instance. Prometheus will identify the instance based on the name tag.
terraform.tfvars
# Update this value to the same region as your existing Terraform Enterprise instance.
aws_region = "example_region"

# Update this value to match your existing Terraform Enterprise 'name' tag value.
tfe_tag_name = "example-tag-name"
Deploy Prometheus and Grafana
In your terminal, initialize your configuration.
$ terraform init

Initializing the backend...

Initializing provider plugins...
- Finding hashicorp/aws versions matching "~> 4.4.0"...
- Installing hashicorp/aws v4.4.0...
- Installed hashicorp/aws v4.4.0 (signed by HashiCorp)

Terraform has created a lock file .terraform.lock.hcl to record the provider
selections it made above. Include this file in your version control repository
so that Terraform can guarantee to make the same selections by default when
you run "terraform init" in the future.

Terraform has been successfully initialized!

You may now begin working with Terraform. Try running "terraform plan" to see
any changes that are required for your infrastructure. All Terraform commands
should now work.

If you ever set or change modules or backend configuration for Terraform,
rerun this command to reinitialize your working directory. If you forget, other
commands will detect it and remind you to do so if necessary.
Now, apply the configuration to create your infrastructure. Respond yes to the prompt to confirm the operation.
$ terraform apply

##...

Do you want to perform these actions?
  Terraform will perform the actions described above.
  Only 'yes' will be accepted to approve.

  Enter a value: yes

Plan: 5 to add, 0 to change, 0 to destroy.

Changes to Outputs:
  + grafana_dashboard_url    = (known after apply)
  + prometheus_dashboard_url = (known after apply)

##...
aws_iam_role.prometheus_aws_iam_role: Creation complete after 1s [id=prometheus_aws_iam_role]
aws_iam_role_policy.prometheus_iam_role_policy: Creation complete after 1s [id=prometheus_aws_iam_role:prometheus_iam_role_policy]
aws_iam_instance_profile.prometheus_iam_instance_profile: Creation complete after 1s [id=prometheus_iam_instance_profile]
aws_security_group.prometheus: Creation complete after 3s [id=sg-0740d374a0bffff55]
##...
aws_instance.prometheus_instance: Creation complete after 1m11s [id=i-0e2e4ee0249363d87]

Apply complete! Resources: 5 added, 0 changed, 0 destroyed.

Outputs:

grafana_dashboard_url = "http://54.152.163.141:3000"
prometheus_dashboard_url = "http://54.152.163.141:9090/graph"
Verify Prometheus and Grafana instance
Navigate to the endpoints in your Terraform output values to verify your deployment.
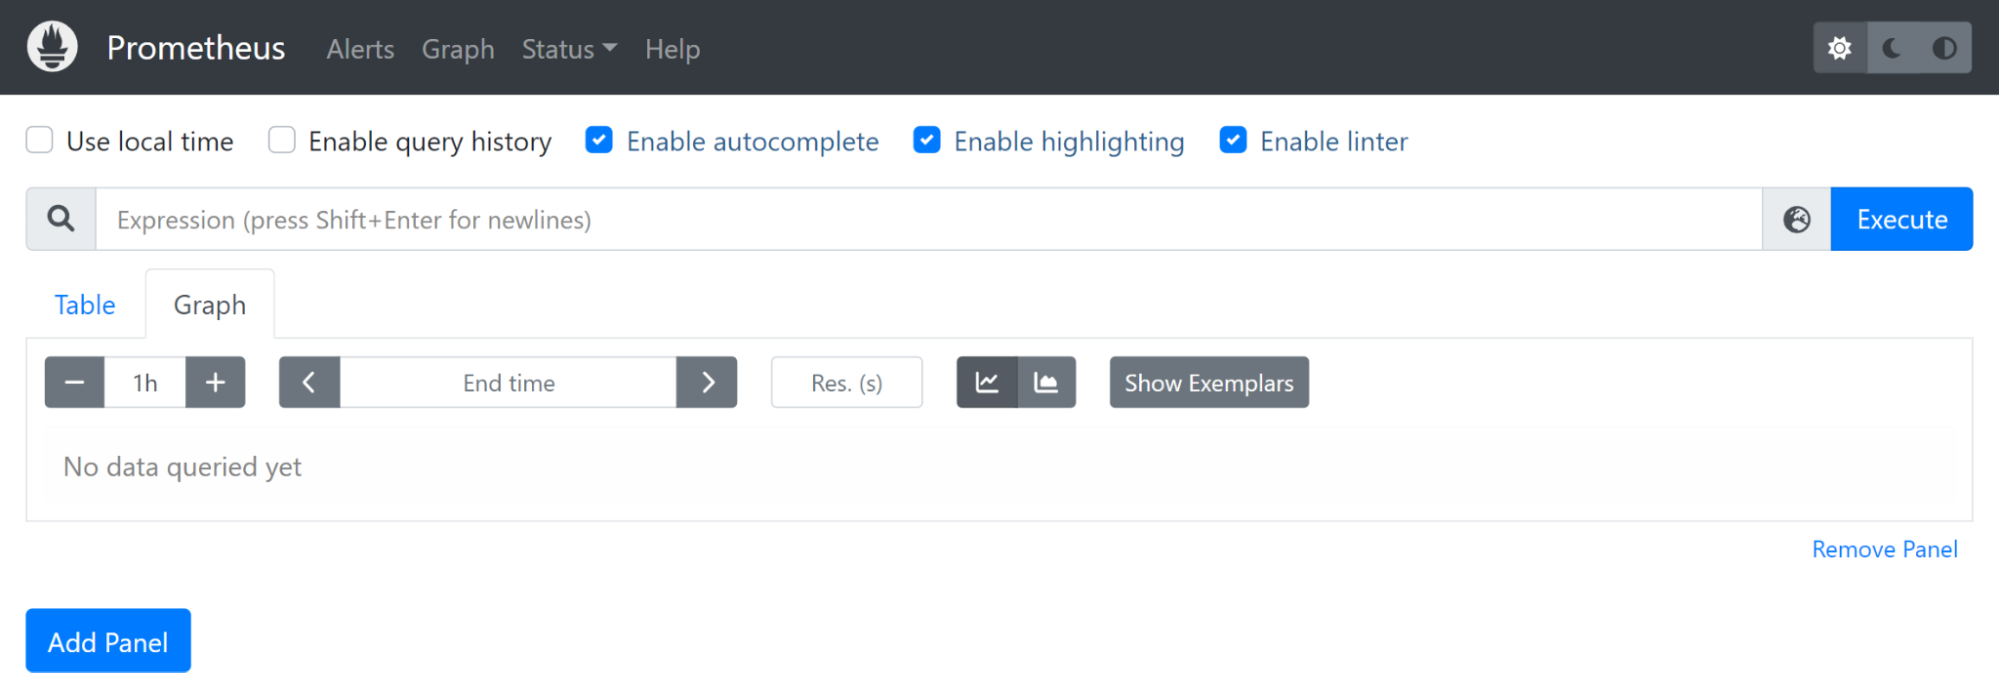
First, visit the Prometheus dashboard. Copy the prometheus_dashboard_url output value into your browser, leaving off the double quotes.
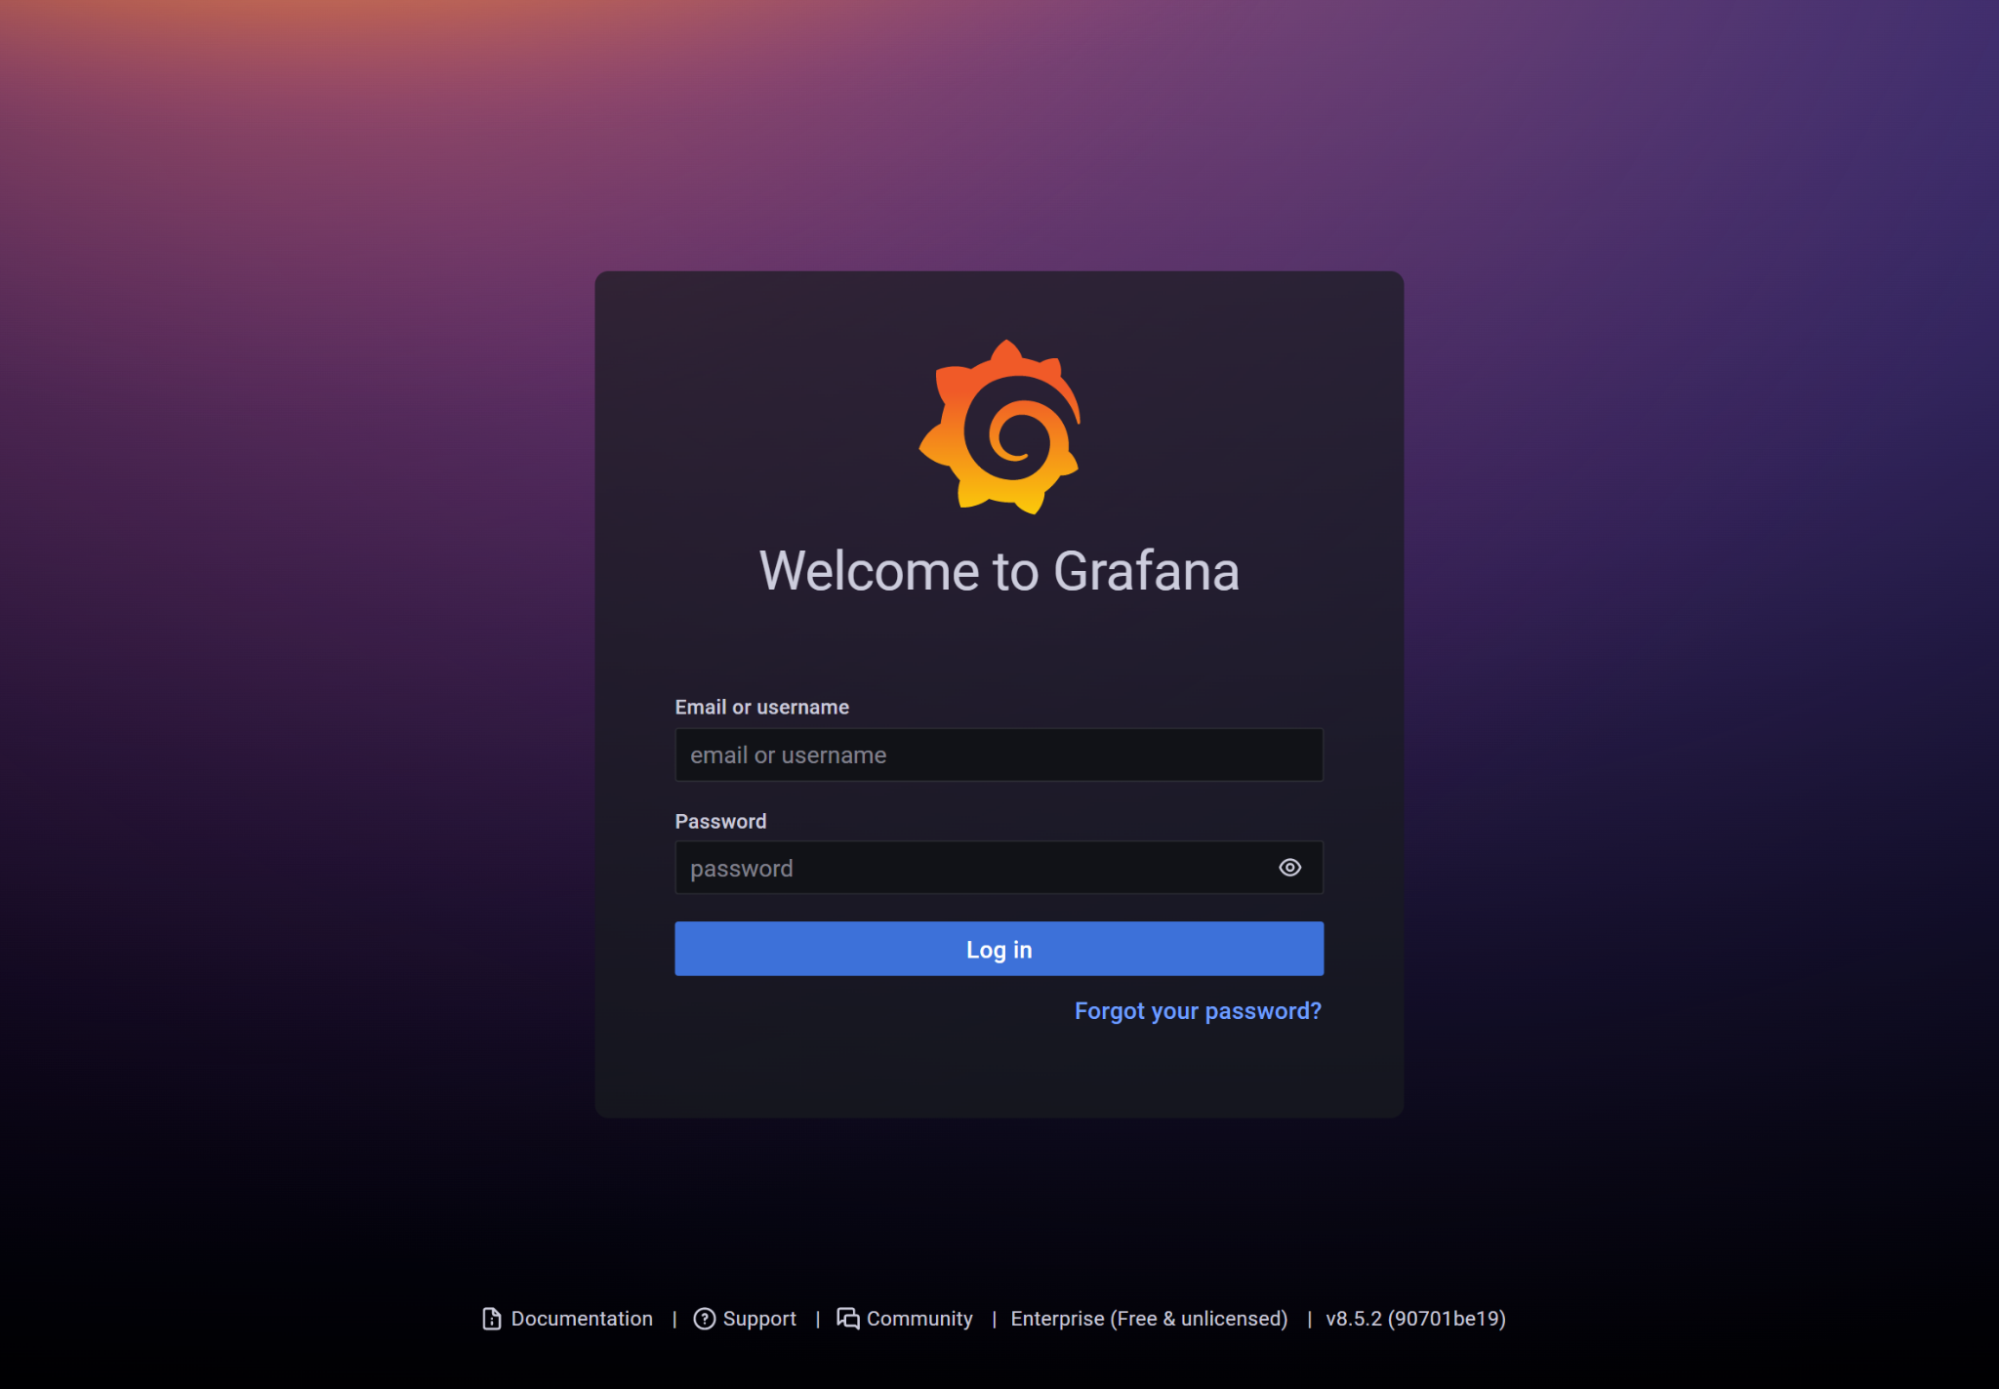
Then, visit the Grafana dashboard. Copy the grafana_dashboard_url output value into your browser, excluding the double quotes. Log in with the default username and password: admin and admin. You will be prompted to create a new password. Click Skip below the input fields.
View metrics in Prometheus
In your Prometheus dashboard, type tfe in the expression field. If Prometheus has successfully scraped the Terraform Enterprise metrics endpoint, Prometheus will display a list of available Terraform Enterprise metrics.
Search for tfe_container_cpu_usage_kernel_ns and press the Execute button. The table and graph tabs now display Terraform Enterprise’s CPU usage metrics.
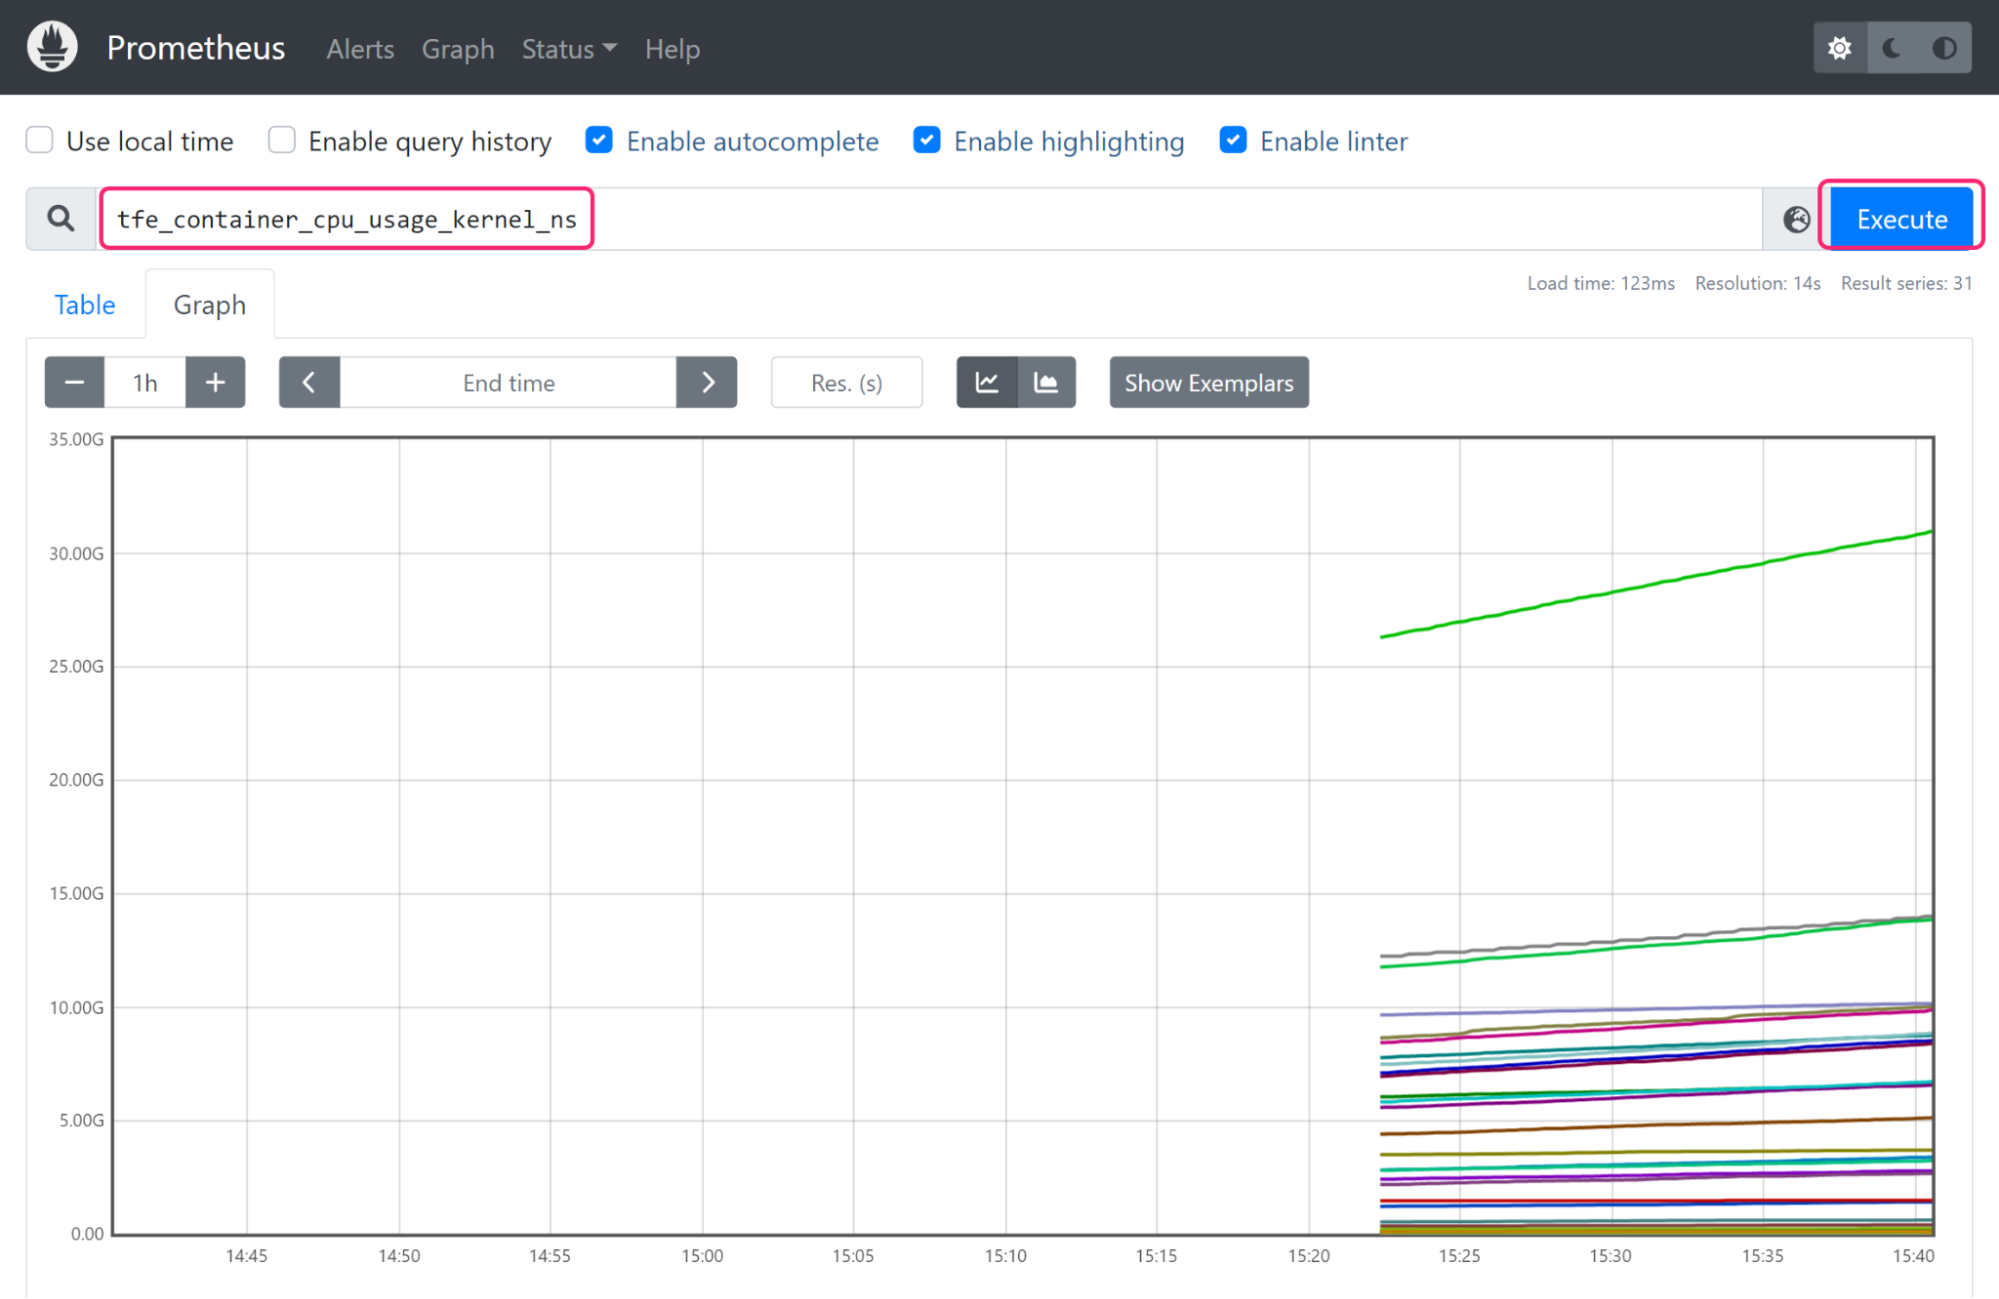
Terraform Enterprise runs take place in ephemeral containers which can make metrics difficult to understand and parse. Terraform Enterprise metric labels such as run_type, run_id, workspace_name and organization_name can help you identify resource-heavy workspaces or runs.
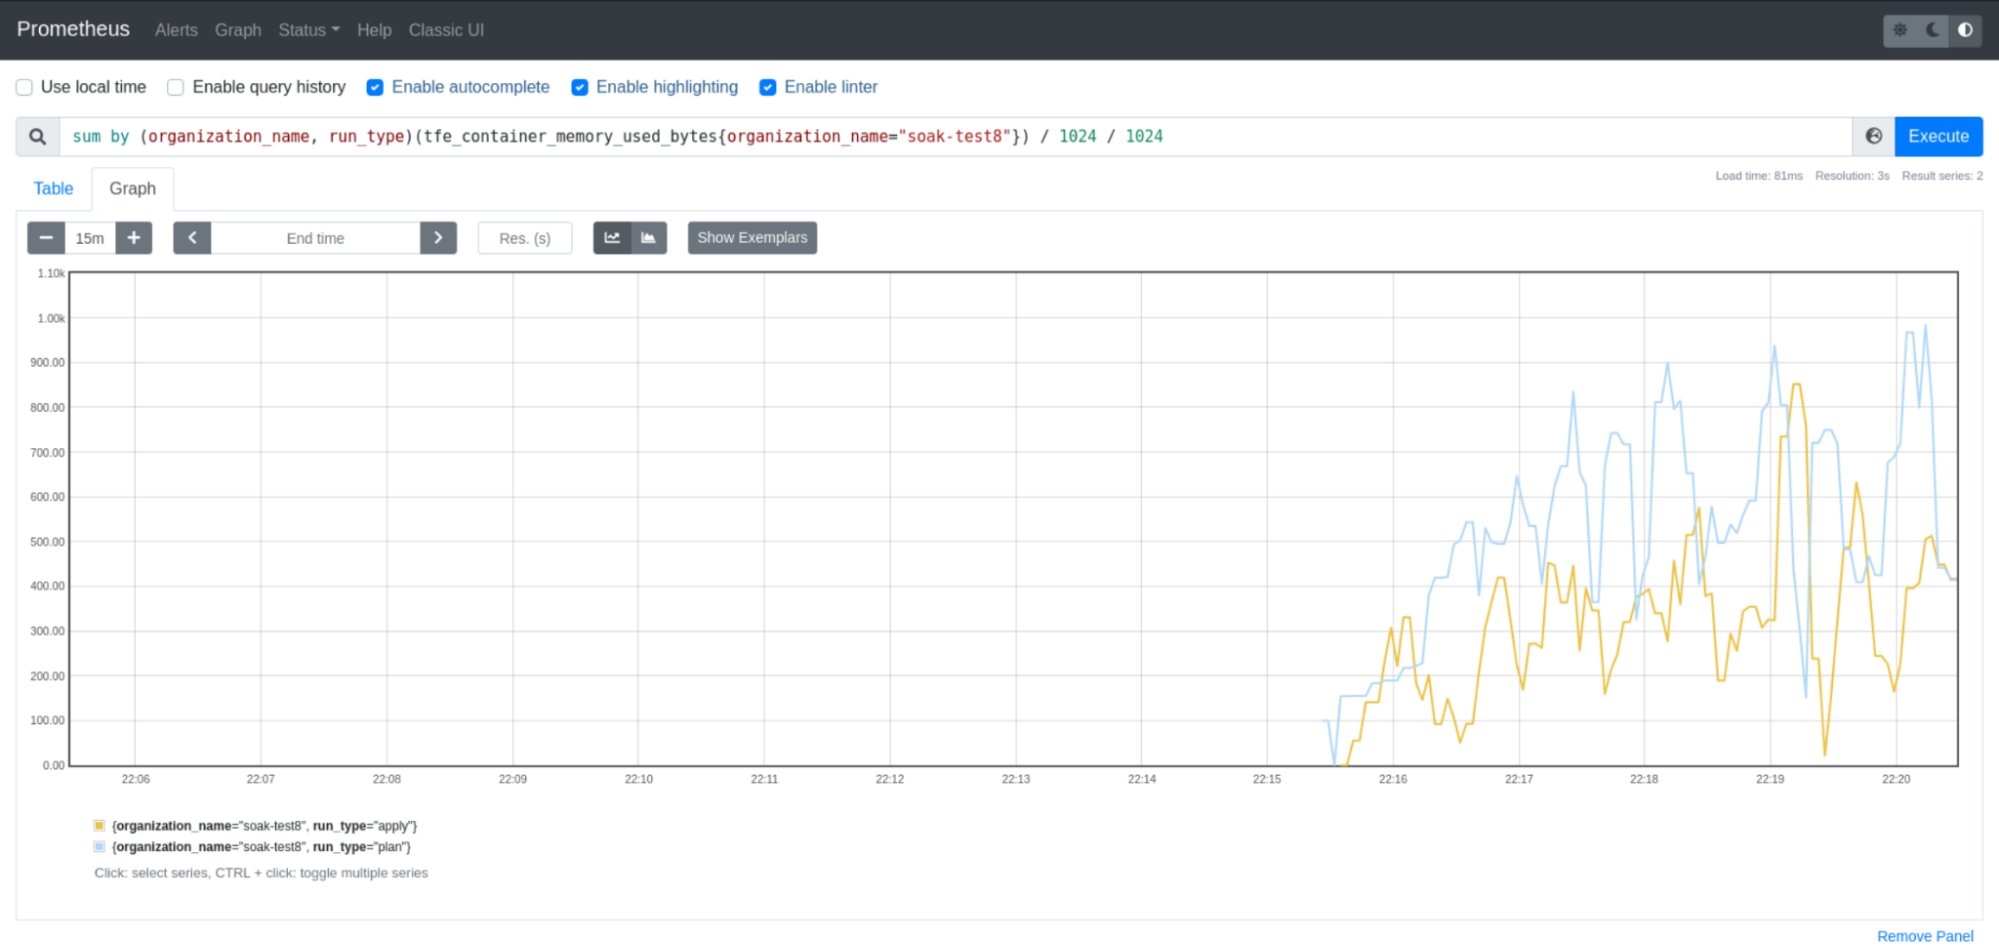
Paste the following query in the expression field. Replace ORG_NAME with the name of your Terraform Enterprise organization. This query will group memory usage by run_type for the specified organization name. The results will help you identify workspaces that may be using more memory than expected during their Terraform runs. You can then troubleshoot the related Terraform configuration.
sum by (run_type)(tfe_container_memory_used_bytes{organization_name="ORG_NAME"}) / 1024 / 1024
Display the CPU usage per Terraform Enterprise container by entering the following query.
sum by (name)((rate(tfe_container_cpu_usage_kernel_ns{run_type=""}[1m]) + rate(tfe_container_cpu_usage_user_ns{run_type=""}[1m])) / 1e7)
Display the memory usage per Terraform Enterprise container by entering the following query.
sum by (name)(tfe_container_memory_used_bytes{run_type=""}) / 1024 / 1024
You can learn more about creating your own Prometheus queries in the Prometheus documentation.
View metrics in Grafana
Grafana is an open-source tool that interactively displays metrics from many different platforms. It provides charts, graphs, and alerts when connected to supported data sources like Prometheus.
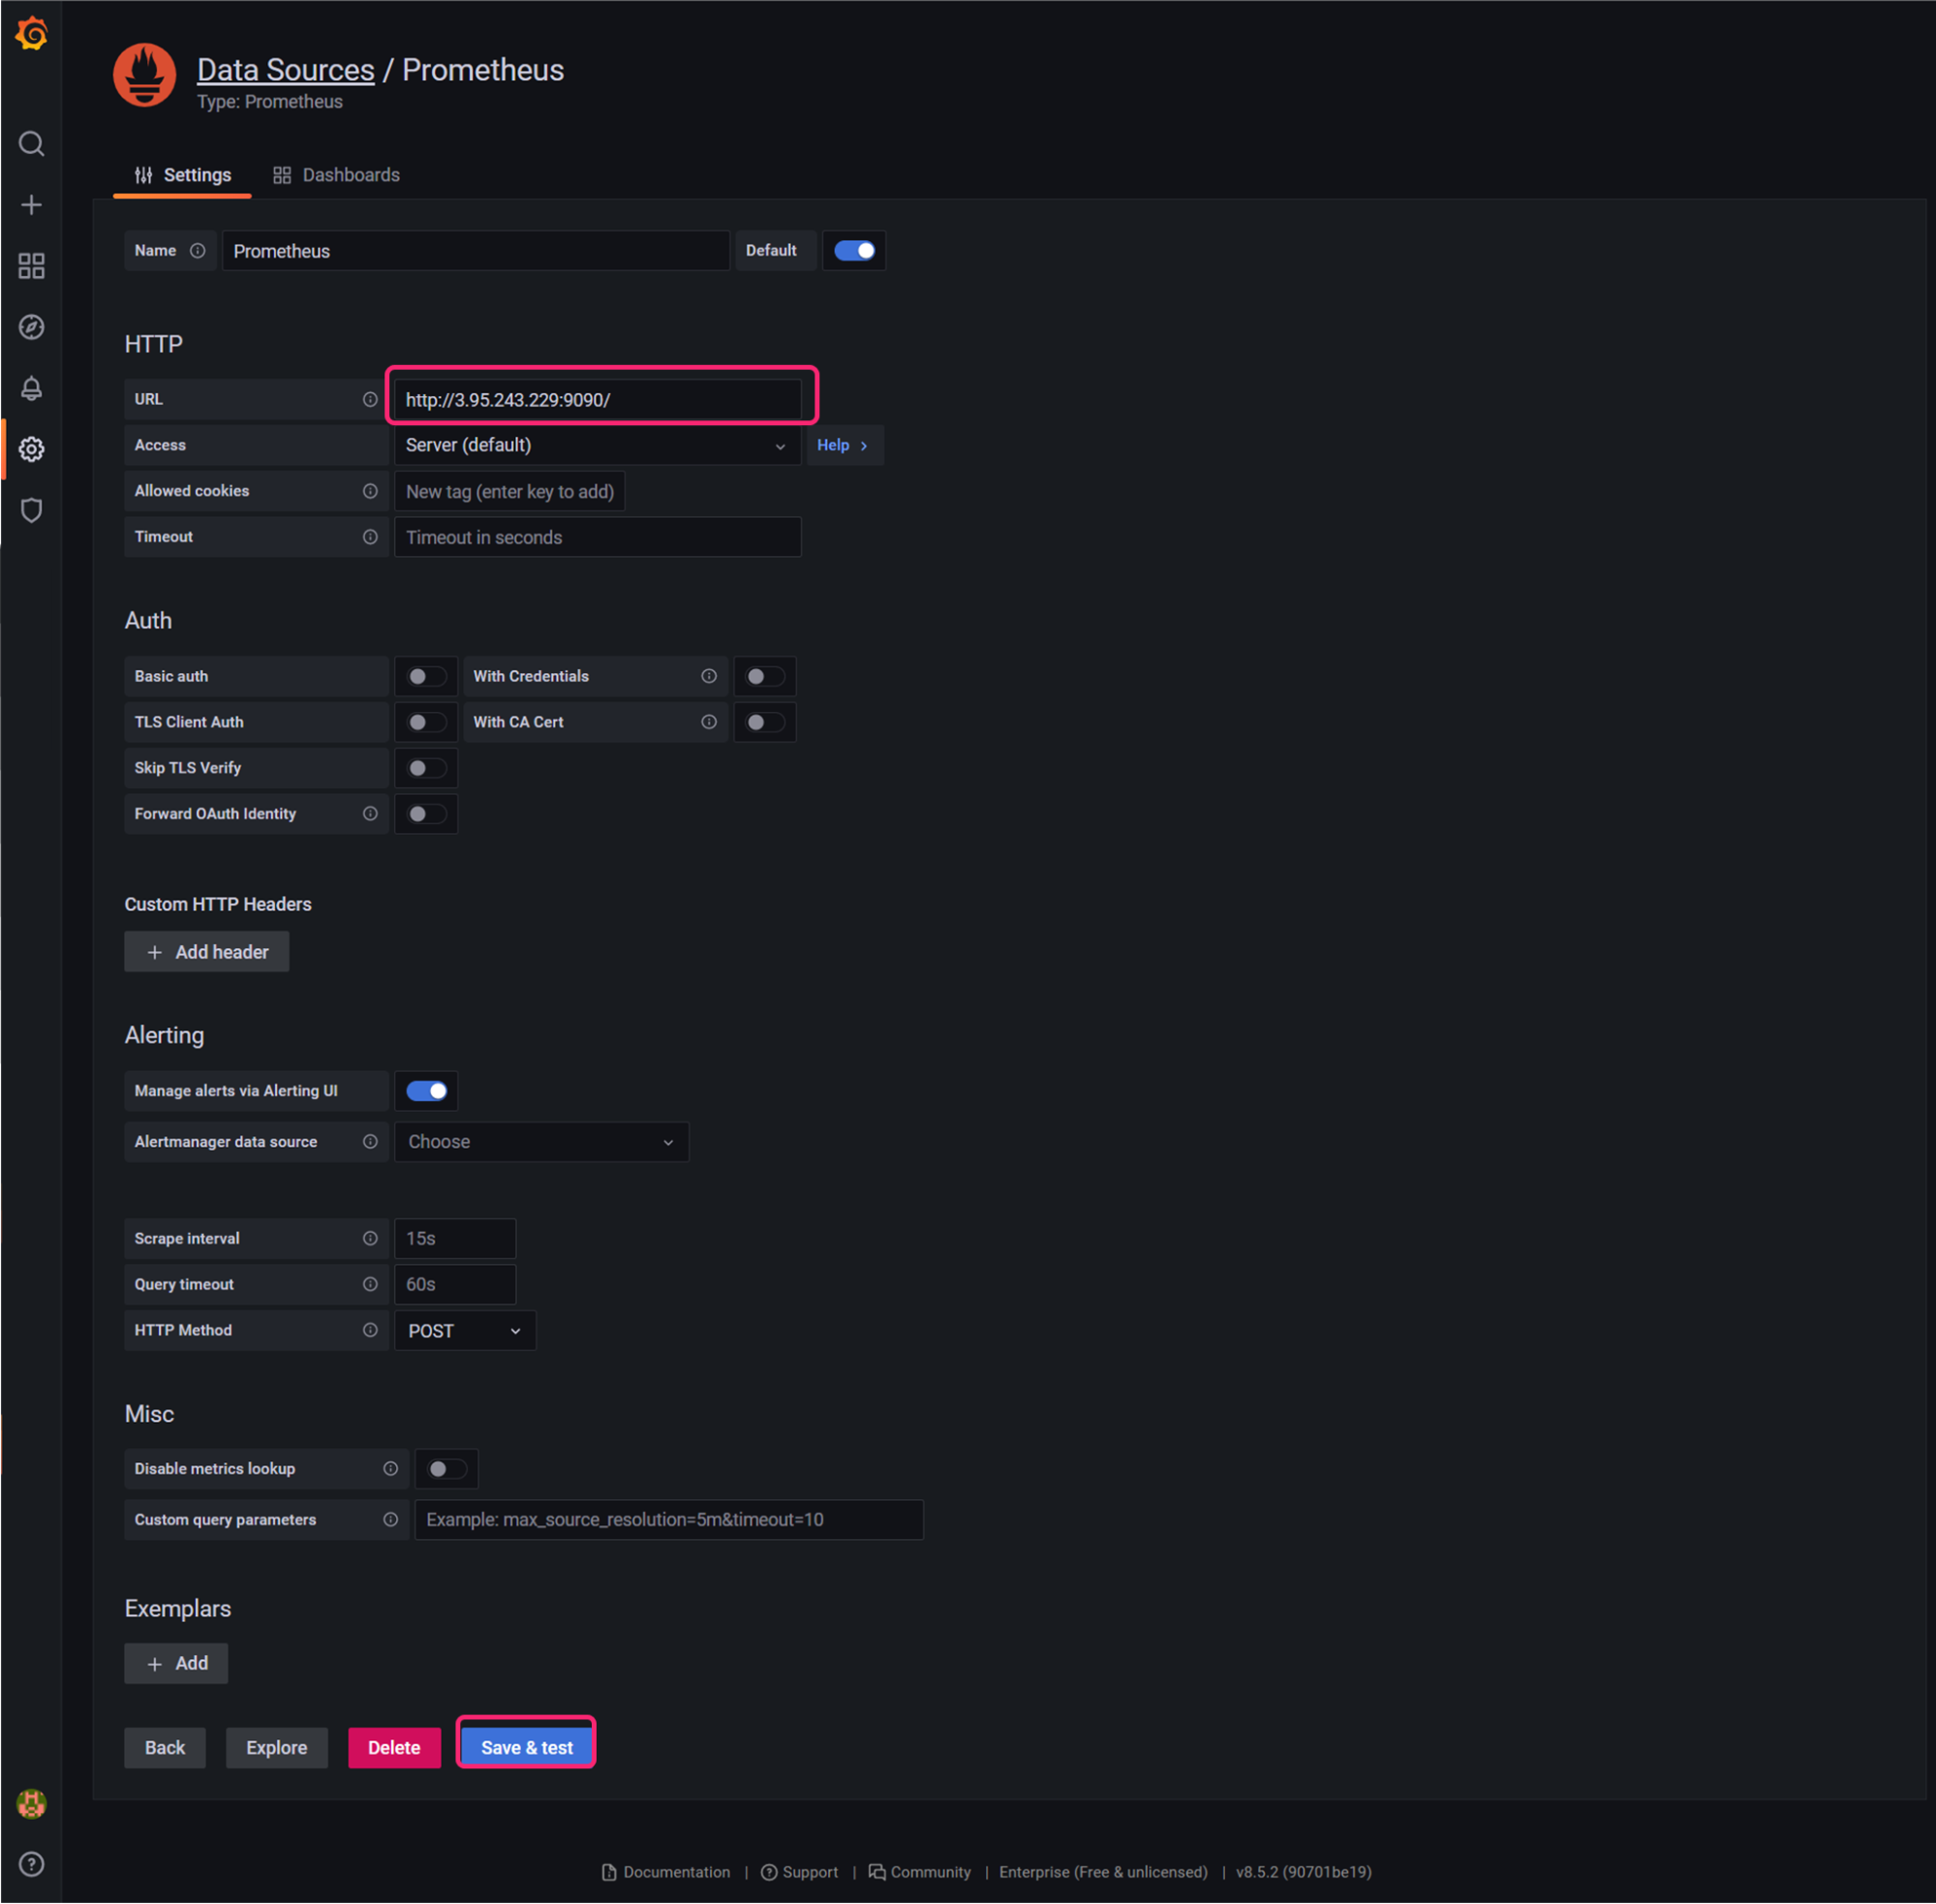
Go to your Grafana dashboard and add the Prometheus application as a data source for Grafana.
- Click on the cogwheel in the left sidebar to open the Configuration menu.
- Click on Data Sources.
- Click on Add data source.
- Select Prometheus as the type.
- Set the appropriate
prometheus_dashboard_urlendpoint returned in your Terraform outputs without the/graphpath (i.e.http://<IP>:9090). Click Save & Test to save the new data source.
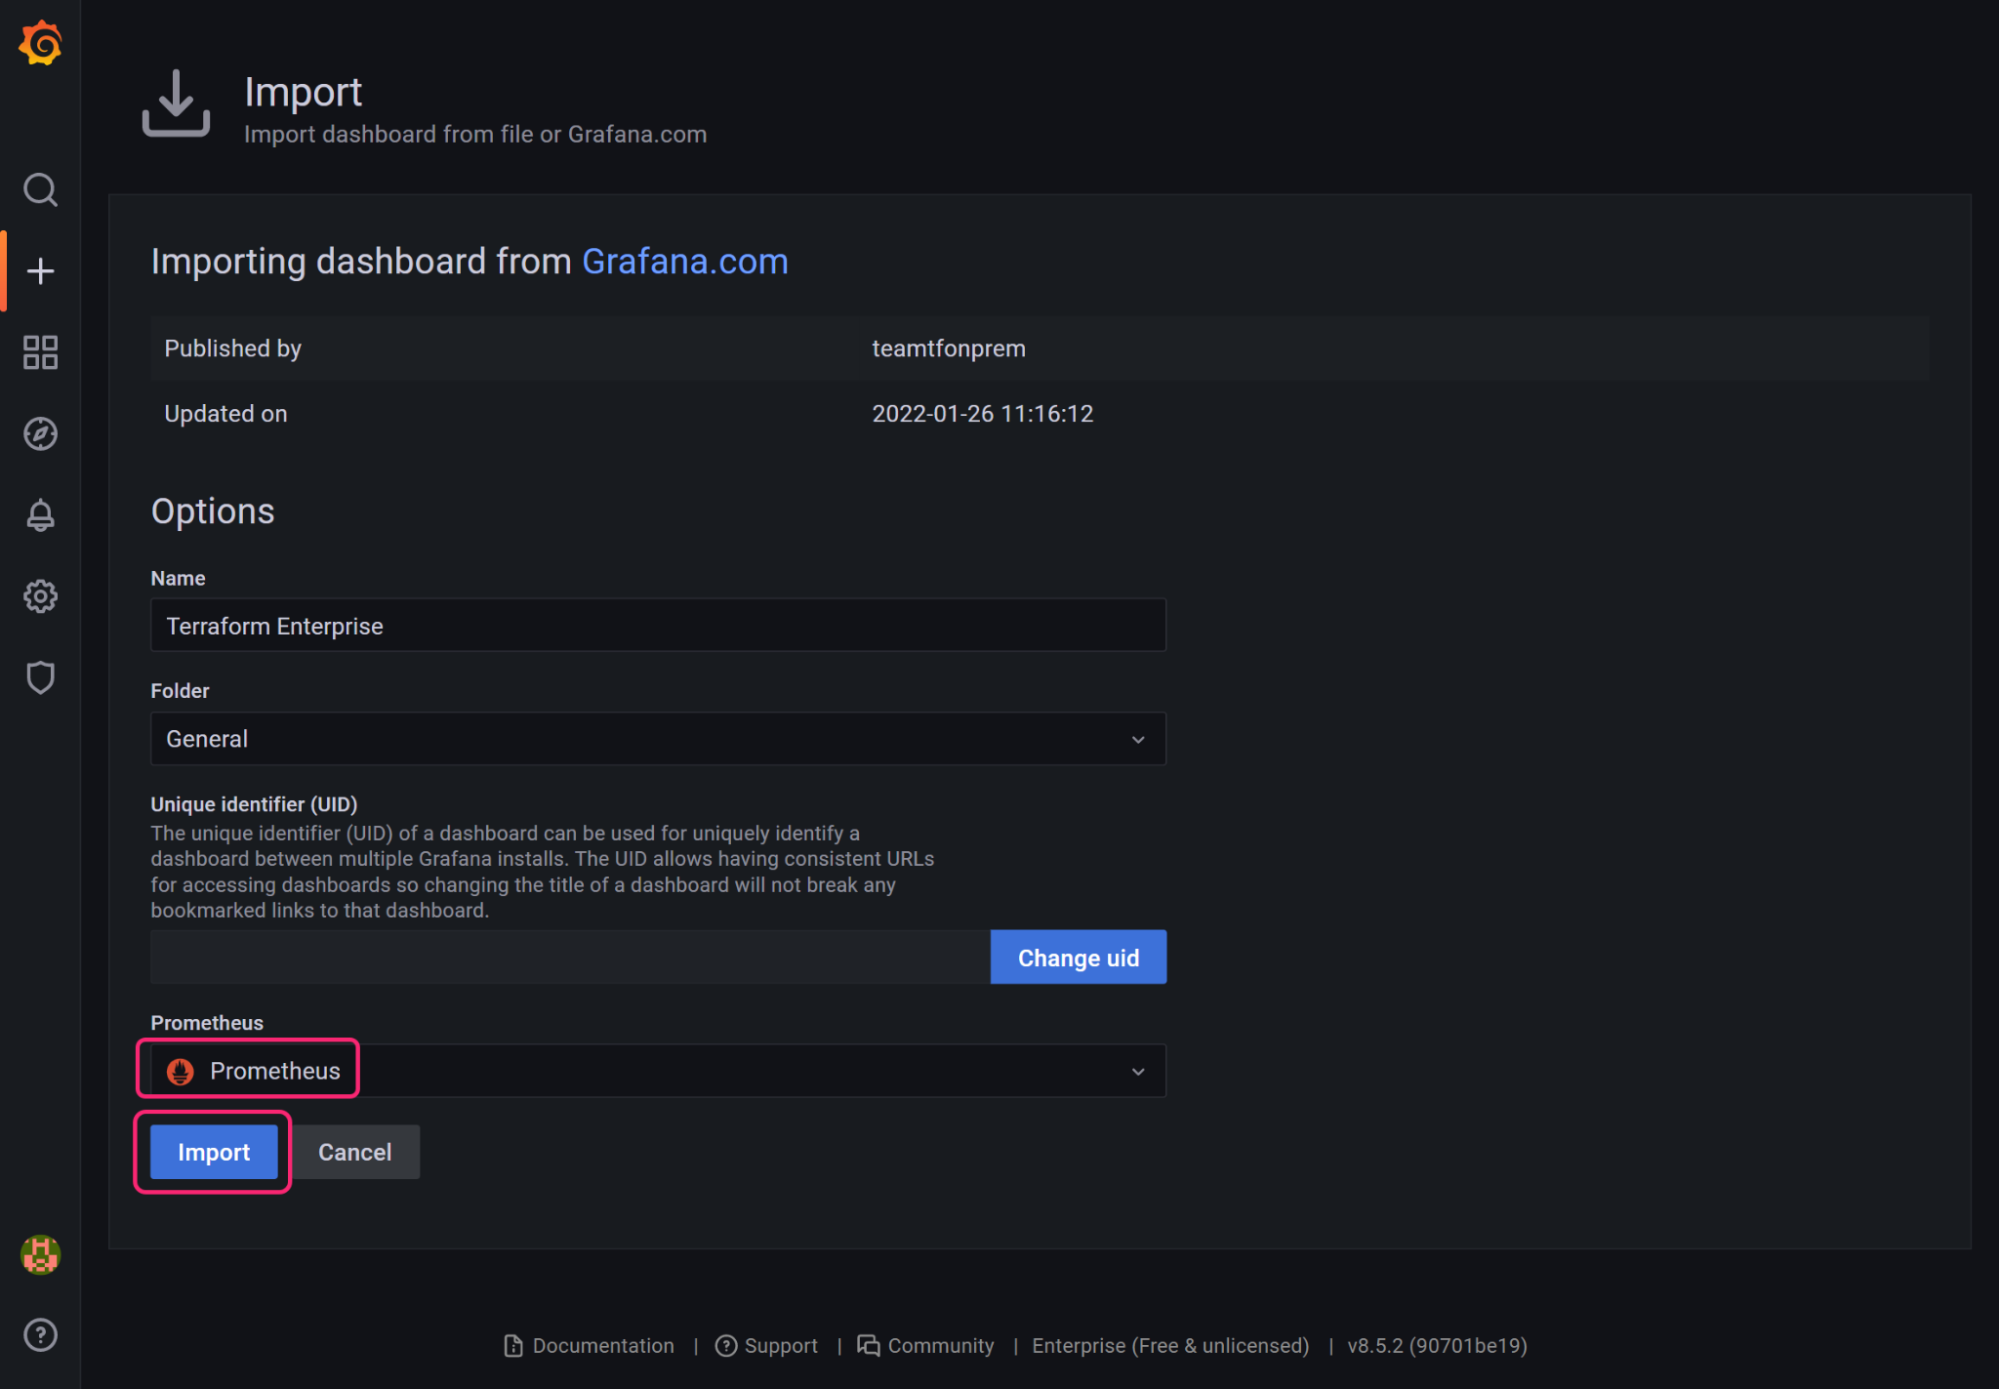
Now add a sample dashboard that is maintained by the Hashicorp Terraform engineering team. The dashboard contains several panels that are populated with Terraform Enterprise metrics.
- Hover over the Dashboards icon (the icon with four squares) in the left sidebar
- Click on + Import
- Paste the ID
15630into the import field and click the Load button next to the field - On the next screen, select your Prometheus data source from the drop down menu and click the Import button
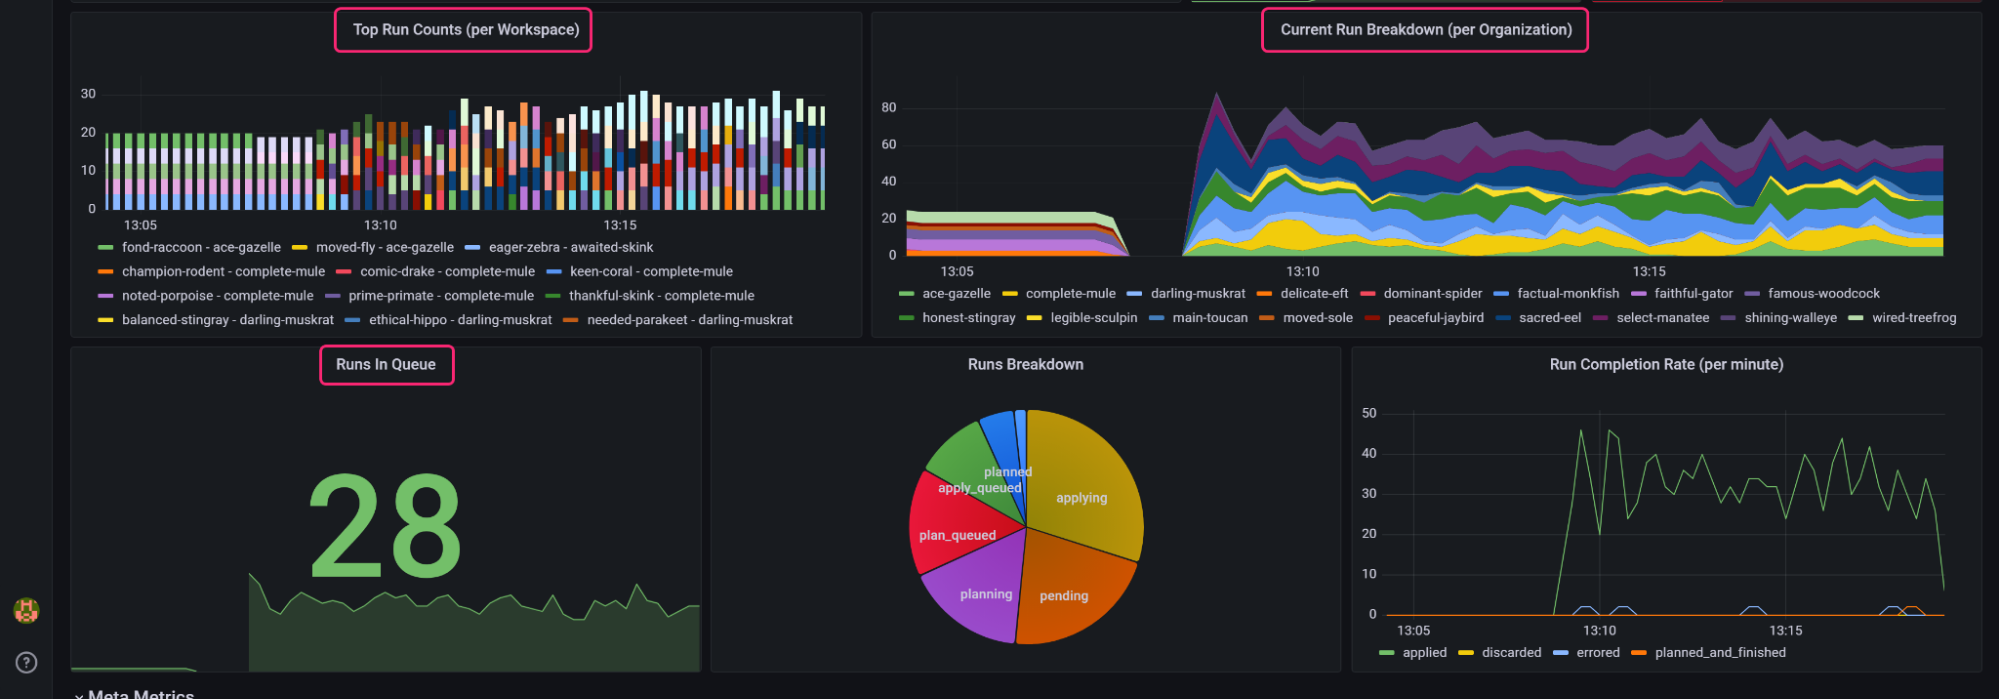
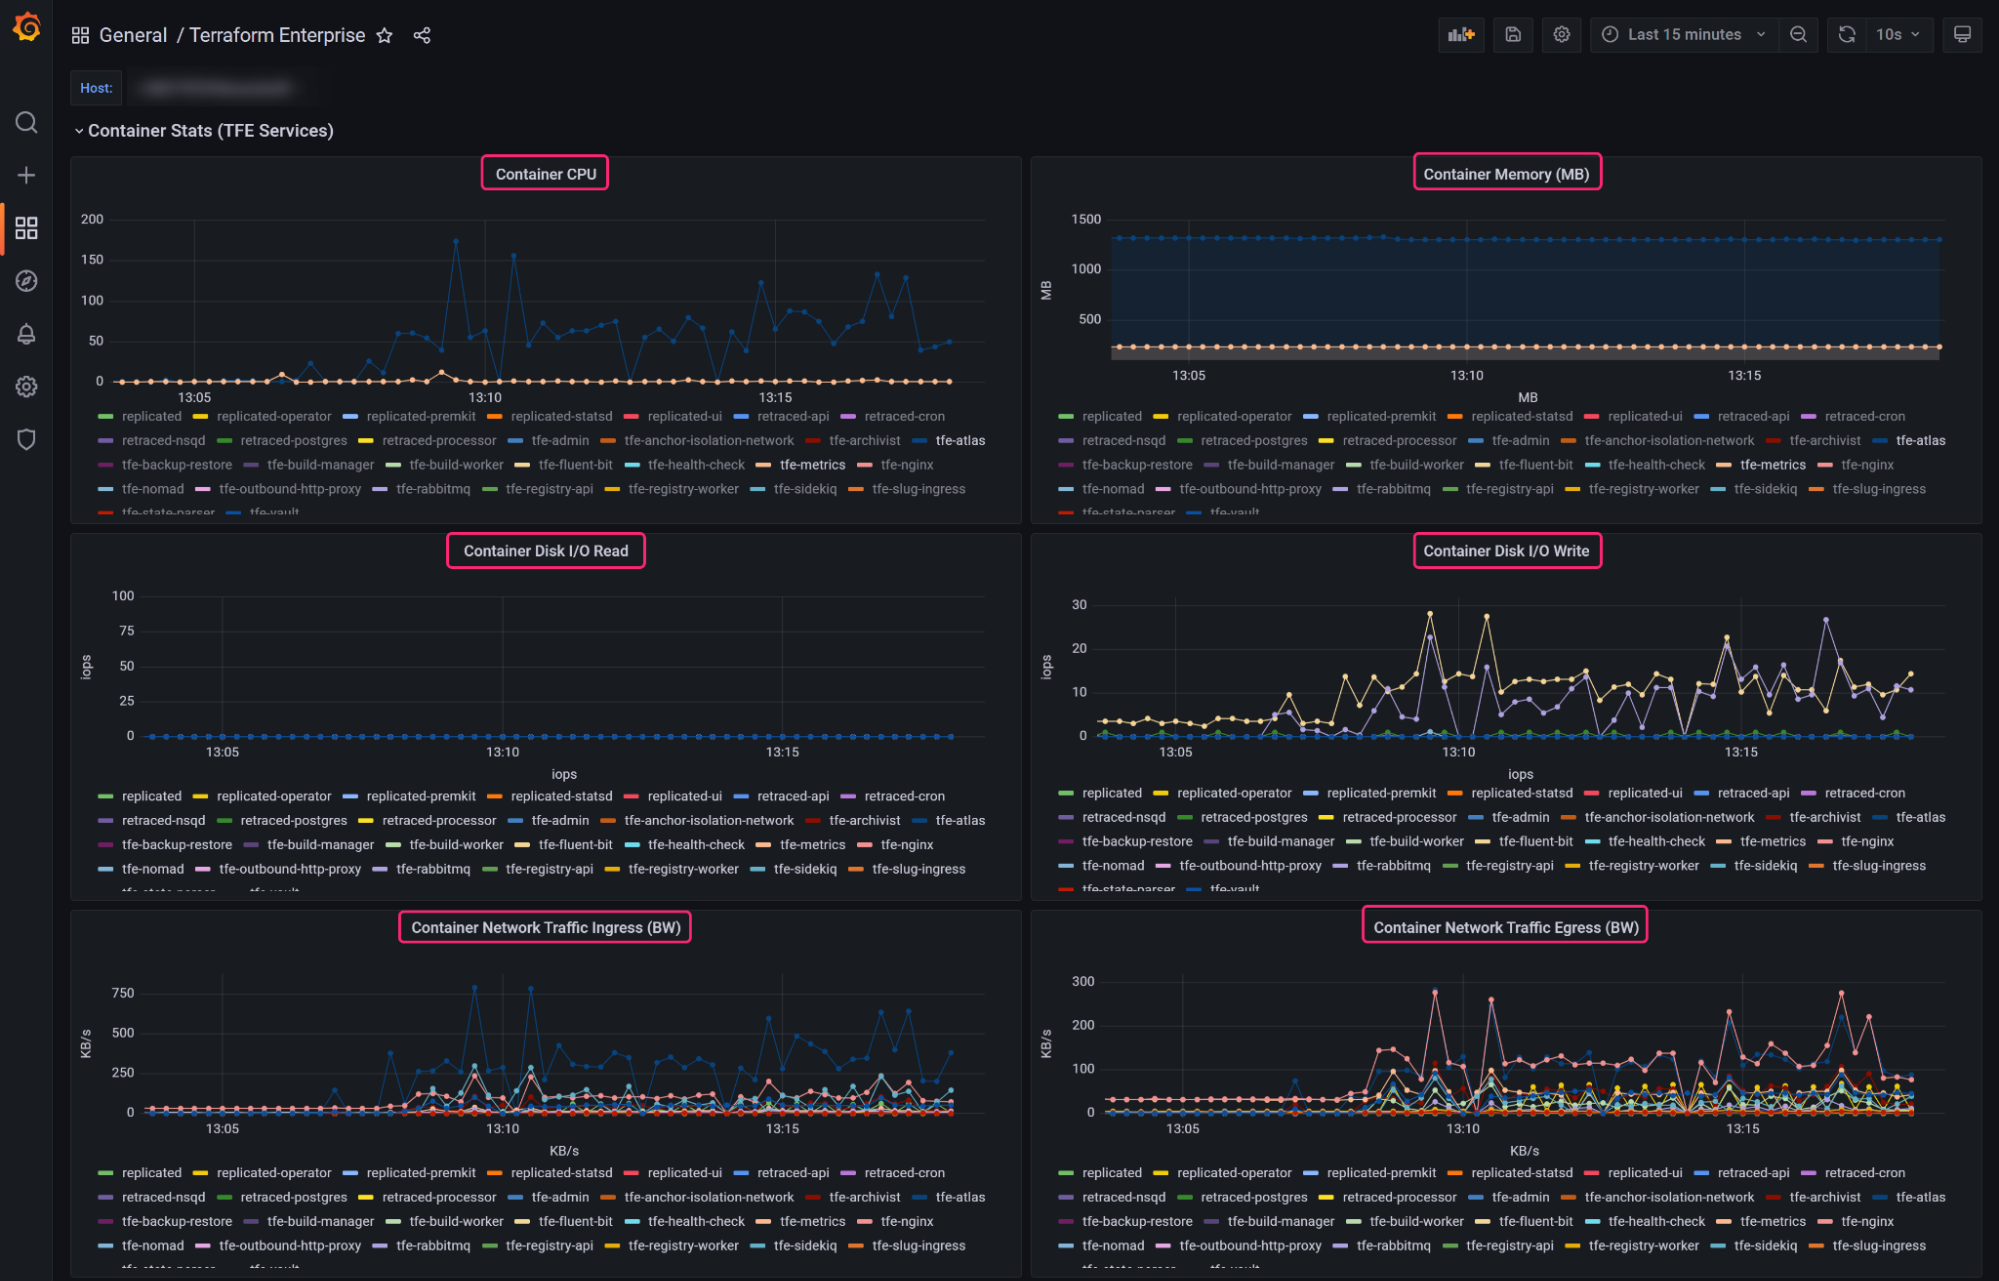
The dashboard loads and displays scraped metrics, which show you how your Terraform Enterprise instance is performing. The dashboard also displays usage data, including the number of current plans and applys, the number of run per workspace, and runs per organization. You can use this data to optimize your Terraform Enterprise instance's performance.
For example, by default Terraform Enterprise executes up to 10 parallel Terraform runs at a time. If you attempt to execute more than 10 runs at a time, Terraform Enterprise will queue them until it has finished executing previous runs. If you frequently see a large number of runs in the "Runs In Queue" Grafana dashboard panel it may indicate that your current capacity settings should be optimized. To reduce wait times, you could increase the number of parallel runs in the capacity and concurrency settings menu.
You could also monitor which workspaces or organizations execute the most runs by monitoring the current run breakdown per organization and top run counts per workspace and adjust their user workload for better distribution of tasks.
The dashboard also shows per-container resource consumption, including memory consumption, disk I/O read and write, and container network ingress/egress. Terraform Enterprise runs take place in Docker containers that only exist during the duration of the run. If your Terraform configuration causes a run to use too much memory, disk I/O, or transmit too much data, this dashboard will help you identify it and determine if the problem is caused by inefficient Terraform configuration, or if you need to increase the capacity of the run containers.
You can also customize the dashboard by following the Grafana documentation.
Destroy Prometheus and Grafana
Now that you have completed this tutorial, destroy the demonstration instance hosting Prometheus and Grafana. Use production deployments of Prometheus and Grafana for official monitoring and reporting of scraped metrics.
Destroy the instance and respond yes to the prompt
to confirm the operation.
$ terraform destroy
Terraform used the selected providers to generate the following execution plan. Resource actions are indicated with the following symbols:
  - destroy

Terraform will perform the following actions:
##...
Plan: 0 to add, 0 to change, 5 to destroy.

Changes to Outputs:
  - grafana_dashboard_url    = "http://54.152.163.141:3000" -> null
  - prometheus_dashboard_url = "http://54.152.163.141:9090/graph" -> null

Do you really want to destroy all resources?
  Terraform will destroy all your managed infrastructure, as shown above.
  There is no undo. Only 'yes' will be accepted to confirm.

  Enter a value: yes

##...
Destroy complete! Resources: 5 destroyed.
Next steps
In this tutorial, you used Prometheus and Grafana to display scraped metrics from Terraform Enterprise. You enabled the Terraform Enterprise metrics endpoint in the admin dashboard, set up Prometheus to scrape emitted data, set up Grafana to import the scraped data from Prometheus, and imported a sample dashboard to visualize the data.
Learn more about Prometheus and Grafana:
- Visit the Datadog log forwarding Learn pages to learn more about Terraform Enterprise log forwarding.
- Review the Prometheus Documentation to learn more about different configuration possibilities.
- Review the Grafana Documentation to learn more about interacting with the prometheus data source within Grafana.
- Refer to the Monitoring a Terraform Enterprise Instance documentation to learn about the metrics available for your version of Terraform Enterprise.
- Visit the Terraform Enterprise Documentation pages to learn more about capacity and concurrency settings for your Terraform Enterprise instance.