Visualize Boundary metrics with Prometheus and Grafana
Boundary exposes worker and controller metrics in the OpenMetrics format so you can track health and performance of self-managed deployments. This tutorial enables metrics collection for Boundary Enterprise or Boundary Community Edition, scrapes metrics with Prometheus, and visualizes the data in Grafana.
Background
Visibility into Boundary workers and controllers plays an important role in ensuring the health of production deployments. Boundary supports monitoring capabilities using the OpenMetric exposition format, enabling administrators to collect the data using tools like Prometheus and export it into a data visualizer.
This tutorial reviews metrics collection, and demonstrates how to enable metrics in a realistic deployment scenario. You will use Prometheus to gather metrics, and Grafana for visualization.
Tutorial contents
- Get set up: Boundary
- Install Prometheus
- Examine metrics
- Get set up: Docker Compose
- Configure Prometheus
- Configure Grafana
- Examine graph metrics
Prerequisites
- Docker installed
- Docker-Compose installed
- Boundary installed and added to your
PATH - Terraform installed and
added to your
PATH - Access to run Prometheus
Get set up: Boundary
Metrics are available for controllers and workers in a Boundary deployment. To view metrics data, you will start Boundary in dev mode.
In production deployments, you can enable metrics in Boundary's config
file by declaring an "ops"
listener.
Start boundary dev, which uses a configuration with a pre-defined ops listener.
$ boundary dev
==> Boundary server configuration:

                        [Bsr] Aead Key Bytes: HfI+wbOG2H7ygV2Fjl2yZMXNoJpJxON0/lm2IkXrZK8=
                   [Recovery] Aead Key Bytes: JhyU63R35er6wj7XNr4h2aiypGfVRBHVgzDFAG8jQWg=
                       [Root] Aead Key Bytes: CgTH95/zowmYlmWhD+TcEn5a93nGEpEgsdLTApzLCgM=
        [Worker-Auth-Storage] Aead Key Bytes: x9ATd1ozsog5Ex/8gLO6BbvYMnZ2VCHetx9DxW2tpR8=
                [Worker-Auth] Aead Key Bytes: KMjRg+3YxP1LyxZO8EB/g2+IyWIejRIjPCTVx5e4AT8=
                             [Bsr] Aead Type: aes-gcm
                        [Recovery] Aead Type: aes-gcm
                            [Root] Aead Type: aes-gcm
             [Worker-Auth-Storage] Aead Type: aes-gcm
                     [Worker-Auth] Aead Type: aes-gcm
                                         Cgo: disabled
              Controller Public Cluster Addr: 127.0.0.1:9201
                      Dev Database Container: heuristic_murdock
                            Dev Database Url: postgres://postgres:password@localhost:55000/boundary?sslmode=disable
                  Generated Admin Login Name: admin
                    Generated Admin Password: password
                   Generated Host Catalog Id: hcst_1234567890
                           Generated Host Id: hst_1234567890
                       Generated Host Set Id: hsst_1234567890
  Generated Ldap Auth Method Base Search Dns: users="ou=people,dc=example,dc=org" groups="ou=groups,dc=example,dc=org"
        Generated Ldap Auth Method Host:port: 127.0.0.1:57294 (does not have a root DSE; use simple bind)
               Generated Ldap Auth Method Id: amldap_1234567890
               Generated Oidc Auth Method Id: amoidc_1234567890
                      Generated Org Scope Id: o_1234567890
           Generated Password Auth Method Id: ampw_1234567890
        Generated Postgres Target With Alias: postgres.boundary.dev
                  Generated Project Scope Id: p_1234567890
             Generated Ssh Target With Alias: ssh.boundary.dev
            Generated Target With Address Id: ttcp_1234567890
        Generated Target With Host Source Id: ttcp_0987654321
           Generated Unprivileged Login Name: user
             Generated Unprivileged Password: password
             Generated Web Target With Alias: www.hashicorp.com
                                  Listener 1: tcp (addr: "127.0.0.1:9200", cors_allowed_headers: "[]", cors_allowed_origins: "[*]", cors_enabled: "true", max_request_duration: "1m30s", purpose: "api")
                                  Listener 2: tcp (addr: "127.0.0.1:9201", max_request_duration: "1m30s", purpose: "cluster")
                                  Listener 3: tcp (addr: "127.0.0.1:9203", max_request_duration: "1m30s", purpose: "ops")
                                  Listener 4: tcp (addr: "127.0.0.1:9202", max_request_duration: "1m30s", purpose: "proxy")
                                   Log Level: info
                                       Mlock: supported: false, enabled: false
                                     Version: Boundary v0.21.3
                                 Version Sha: 8c9715c868537616a11e0ea555b20042e212bdbc
                  Worker Auth Current Key Id: commute-unvented-croon-unused-rope-deviant-dab-immature
                    Worker Auth Storage Path: /var/folders/cc/4wl9lb_9575bbg5fncr99vcr0000gn/T/nodeenrollment3217383582
                    Worker Public Proxy Addr: 127.0.0.1:9202

==> Boundary server started! Log data will stream in below:
...
... More output ...
...
Open a web browser and navigate to http://localhost:9203/metrics. The
endpoint displays a list of metrics events, reported in the OpenMetric
format. Monitoring solutions like Prometheus enable metrics reporting by
scraping the values from this endpoint.
Leave dev mode running in the current terminal session, and open a new terminal window or tab to continue the tutorial.
Install Prometheus
Prometheus is an open-source monitoring and alerting toolkit. It gathers and stores metrics reported in the OpenMetric exposition format.
From Prometheus's docs:
Prometheus scrapes metrics from instrumented jobs, either directly or via an intermediary push gateway for short-lived jobs. It stores all scraped samples locally and runs rules over this data to either aggregate and record new time series from existing data or generate alerts. Grafana or other API consumers can be used to visualize the collected data.
Download the latest Prometheus monitoring binary for your system. This tutorial uses version 3.14.0. Extract the archive to your local machine.
For example, on MacOS arm64:
$ curl -OL https://github.com/prometheus/prometheus/releases/download/v3.14.0/prometheus-3.14.0.darwin-amd64.tar.gz
Next, unzip the archive:
$ tar -zxvf prometheus-3.14.0.darwin-amd64.tar.gz
Change into the extracted folder and view its contents:
$ cd prometheus-3.14.0.darwin-amd64/
$ ls -R1
LICENSE
NOTICE
prometheus
prometheus.yml
promtool
The prometheus.yml in this directory is Prometheus's configuration file, used
by the prometheus binary.
Open prometheus.yml in your text editor, and locate static_configs under the
scrape_configs block.
The targets allow you to define the endpoints Prometheus should attempt to
scrape metrics from. Notice that localhost:9090 is already defined for
job_name: "prometheus". This is Prometheus's metrics endpoint, where it
collects data about itself.
For a simple look at metrics, add an additional target for localhost:9203,
the standard metrics endpoint for Boundary.
# my global config
global:
  scrape_interval: 15s # Set the scrape interval to every 15 seconds. Default is every 1 minute.
  evaluation_interval: 15s # Evaluate rules every 15 seconds. The default is every 1 minute.
  # scrape_timeout is set to the global default (10s).

# Alertmanager configuration
alerting:
  alertmanagers:
    - static_configs:
        - targets:
          # - alertmanager:9093

# Load rules once and periodically evaluate them according to the global 'evaluation_interval'.
rule_files:
  # - "first_rules.yml"
  # - "second_rules.yml"

# A scrape configuration containing exactly one endpoint to scrape:
# Here it's Prometheus itself.
scrape_configs:
  # The job name is added as a label `job=<job_name>` to any timeseries scraped from this config.
  - job_name: "prometheus"

    # metrics_path defaults to '/metrics'
    # scheme defaults to 'http'.

    static_configs:
      - targets: ["localhost:9090", "localhost:9203"]
Save this file, and return to your terminal.
Examine metrics
With the configuration file targeting Boundary's /metrics endpoint, you can
start Prometheus to begin monitoring.
Ensure you are in the extracted directory. Execute Prometheus,
supplying the prometheus.yml config file.
$ ./prometheus --config.file="prometheus.yml"
time=2026-08-25T14:12:48.407-04:00 level=INFO source=main.go:1736 msg="updated GOGC" old=100 new=75
time=2026-08-25T14:12:48.408-04:00 level=INFO source=main.go:795 msg="Leaving GOMAXPROCS=12: CPU quota undefined" component=automaxprocs
time=2026-08-25T14:12:48.408-04:00 level=INFO source=memlimit.go:198 msg="GOMEMLIMIT is updated" component=automemlimit package=github.com/KimMachineGun/automemlimit/memlimit GOMEMLIMIT=34789235097 previous=9223372036854775807
time=2026-08-25T14:12:48.408-04:00 level=INFO source=main.go:902 msg="Starting Prometheus Server" mode=server version="(version=3.14.0, branch=HEAD, revision=d7598b7141418fa35be2b5ec5d0fefb634199610)"
time=2026-08-25T14:12:48.408-04:00 level=INFO source=main.go:907 msg="operational information" build_context="(go=go1.26.6, platform=darwin/amd64, user=root@090d6138be9a, date=20260817-16:49:46, tags=netgo,builtinassets)" host_details=(darwin) fd_limits="(soft=138240, hard=unlimited)" vm_limits="(soft=unlimited, hard=unlimited)"
time=2026-08-25T14:12:48.534-04:00 level=INFO source=web.go:727 msg="Start listening for connections" component=web address=0.0.0.0:9090
time=2026-08-25T14:12:48.535-04:00 level=INFO source=main.go:1468 msg="Starting TSDB ..."
time=2026-08-25T14:12:48.538-04:00 level=INFO source=tls_config.go:372 msg="Listening on" component=web address=[::]:9090
time=2026-08-25T14:12:48.538-04:00 level=INFO source=tls_config.go:375 msg="TLS is disabled." component=web http2=false address=[::]:9090
time=2026-08-25T14:12:48.540-04:00 level=INFO source=head.go:738 msg="Replaying on-disk memory mappable chunks if any" component=tsdb
time=2026-08-25T14:12:48.540-04:00 level=INFO source=head.go:824 msg="On-disk memory mappable chunks replay completed" component=tsdb duration=12.792µs
time=2026-08-25T14:12:48.540-04:00 level=INFO source=head.go:832 msg="Replaying WAL, this may take a while" component=tsdb
time=2026-08-25T14:12:48.542-04:00 level=INFO source=head.go:927 msg="WAL segment loaded" component=tsdb segment=0 maxSegment=0 duration=1.483875ms
time=2026-08-25T14:12:48.542-04:00 level=INFO source=head.go:964 msg="WAL replay completed" component=tsdb checkpoint_replay_duration=225.541µs wal_replay_duration=1.498583ms wbl_replay_duration=76.375µs chunk_snapshot_load_duration=0s mmap_chunk_replay_duration=12.792µs total_replay_duration=1.95425ms
time=2026-08-25T14:12:48.544-04:00 level=INFO source=main.go:1489 msg="filesystem information" fs_type=1a
time=2026-08-25T14:12:48.544-04:00 level=INFO source=main.go:1492 msg="TSDB started"
time=2026-08-25T14:12:48.544-04:00 level=INFO source=main.go:1690 msg="Loading configuration file" filename=prometheus.yml
time=2026-08-25T14:12:48.545-04:00 level=INFO source=main.go:1106 msg="TSDB retention updated" duration=15d size=0B percentage=0
time=2026-08-25T14:12:48.586-04:00 level=INFO source=main.go:1729 msg="Completed loading of configuration file" db_storage=86.458µs remote_storage=3.5µs web_handler=625ns query_engine=833ns scrape=40.693625ms scrape_sd=34.958µs notify=208.625µs notify_sd=9.167µs rules=5.75µs tracing=18.583µs filename=prometheus.yml totalDuration=42.146459ms
time=2026-08-25T14:12:48.586-04:00 level=INFO source=main.go:1453 msg="Server is ready to receive web requests."
time=2026-08-25T14:12:48.587-04:00 level=INFO source=manager.go:211 msg="Starting rule manager..." component="rule manager"
Open a web browser, and navigate to http://localhost:9090. You will be
redirected to the /graph page, where queries can be constructed and executed.
Type boundary into the search box. Notice that autocomplete shows a scrollable
list of metrics that can be queried for the controller and worker.

The metric names are automatically populated from the values available at the
/metrics endpoint.
Examples of the available metrics include:
Controller metrics:
- HTTP request latency
- HTTP request size
- HTTP response size
- gRPC service latency
Worker metrics:
- Open proxy connections
- Sent bytes for proxying, handled by worker
- Received bytes for proxying, handled by worker
- Time elapsed before a header is written back to the end user
Other metrics:
- Build info for version details
To learn more about specific metrics and how to access them, refer to the metrics documentation.
Execute a simple query by clicking on a metric value. For example, select
boundary_cluster_client_grpc_request_duration_seconds_sum, and then click
Execute.

The
boundary_cluster_client_grpc_request_duration_seconds
metric reports latencies for requests made to the gRPC
service running on the cluster listener.
The returned results show the matching queries. Scrolling through the
Evaluation time allows for quick navigation through metrics reported at a
particular timestamp. Most metrics in this example share a similar timestamp
because Boundary generated the events when you executed boundary dev.
Select the Graph view to show these metrics over time.

Additional queries to Boundary would produce more metrics. For example,
authenticating to Boundary as the admin user would produce more events reported
by the boundary_controller_api_http_request_size_bytes metric.
Open a new terminal and log in as the Boundary admin.
$ boundary authenticate password -auth-method-id ampw_1234567890 -login-name admin
Please enter the password (it will be hidden): <password>

Authentication information:
  Account ID:      acctpw_1234567890
  Auth Method ID:  ampw_1234567890
  Expiration Time: Tue, 26 Apr 2022 16:12:20 MDT
  User ID:         u_1234567890

The token was successfully stored in the chosen keyring and is not displayed here.
Return to Prometheus, and then execute a query for
boundary_controller_api_http_request_size_bytes_sum. This would report a
number of method="get" requests to the API at a single point in time.


Also notice that several metrics are available for boundary_worker. Boundary's
dev mode includes a controller and worker instance for testing. Next, metrics
will be examined using a more realistic Boundary deployment.
When finished examining dev mode metrics, locate the correct shell session and
stop Prometheus using ctrl+c.
Lastly, locate the terminal session where you executed boundary dev, and
stop the dev server using ctrl+c.
Get set up: Docker Compose
The demo environment provided for this tutorial includes a Docker Compose cluster that deploys these containers:
- A Boundary 0.21.0 controller server
- A Boundary database
- 1 worker instance
- 1 postgres database target
- Prometheus
- Grafana
The Terraform Boundary
Provider is
used in this tutorial to provision resources using Docker, and must
be available in your PATH when deploying the demo environment.
To learn more about the various Boundary components, refer back to the Start a development environment tutorial.
Deploy the lab environment
The lab environment can be downloaded or cloned from the following Github repository:
In your terminal, clone the repository to get the example files locally:
$ git clone git@github.com:hashicorp-education/learn-boundary-prometheus-metrics.gitMove into the
learn-boundary-prometheus-metricsfolder.$ cd learn-boundary-prometheus-metricsEnsure that you are in the correct directory by listing its contents.
$ ls -R1
compose
deploy
LICENSE
README.md
terraform

./compose:
Boundary-Overview-Dashboard.json
controller.hcl
datasource.yml
docker-compose.yml
prometheus.yml
worker.hcl

./terraform:
main.tf
outputs.tf
versions.tf
The repository contains the following files:
deploy: A script used to deploy and tear down the Docker-Compose configuration.compose/docker-compose.yml: The Docker-Compose configuration file describing how to provision and network the Boundary cluster.compose/controller.hcl: The controller configuration file.compose/worker.hcl: The worker configuration file.compose/prometheus.yml: The Prometheus configuration file.terraform/main.tf: The Terraform provisioning instructions using the Boundary provider.terraform/outputs.tf: The Terraform outputs file for printing user connection details.
Run the
deployscript to deploy the turorial environment.$ ./deploy all ~/learn-boundary-prometheus-metrics/compose ~/learn-boundary-prometheus-metrics [+] up 7/7 ✔ Container boundary-db-1 Healthy 3.7s ✔ Container boundary-prometheus-1 Started 0.2s ✔ Container boundary-postgres-1 Started 0.2s ✔ Container boundary-db-init-1 Started 3.7s ✔ Container boundary-grafana-1 Started 0.3s ✔ Container boundary-controller-1 Started 4.3s ✔ Container boundary-worker-1 Started 4.5s ~/Downloads/boundary_0.21.3_darwin_arm64/learn-boundary-prometheus-metrics ~/Downloads/boundary_0.21.3_darwin_arm64/learn-boundary-prometheus-metrics/terraform ~/Downloads/boundary_0.21.3_darwin_arm64/learn-boundary-prometheus-metrics Initializing the backend... Initializing provider plugins... - Reusing previous version of hashicorp/boundary from the dependency lock file - Using previously-installed hashicorp/boundary v1.6.1 Terraform has been successfully initialized! ...truncated... boundary_role.org_anon_listing: Creation complete after 4s [id=r_IObkcG5Dqp] boundary_target.ssh: Creation complete after 2s [id=ttcp_0hFDuCpFqz] boundary_target.db: Creation complete after 2s [id=ttcp_zZAecOLG9p] boundary_target.postgres: Creation complete after 2s [id=ttcp_pT7wUxwvc7] boundary_role.org_admin: Creation complete after 5s [id=r_wGjoA1da3d] boundary_role.proj_admin: Creation complete after 5s [id=r_ltLi7HHgAm] Apply complete! Resources: 18 added, 0 changed, 0 destroyed. Outputs: auth_method_id = "ampw_03AWjh6b28" password = <sensitive> username = { "user1" = "user1" }Any resource deprecation warnings in the output can safely be ignored.
Terraform prints the Boundary user login details in the shell output. You can also view the output by running
terraform output -state=./terraform/terraform.tfstate. You will use the user1auth_method_idto authenticate via the CLI and establish sessions.You can tear down the environment at any time by executing
./deploy cleanup.Export the
auth_method_idas an environment variable. You will use this later in the tutorial.$ export BOUNDARY_AUTH_METHOD_ID=$(terraform -chdir=terraform/ output -json | jq -r '.auth_method_id.value')To verify that the environment deployed correctly, print the running docker containers and notice the ones named with the prefix "boundary".
$ docker ps --format "table {{.ID}}\t{{.Names}}\t{{.Image}}"
CONTAINER ID   NAMES                   IMAGE
af3695f86708   boundary-worker-1       hashicorp/boundary:0.21.0
c066a4f4e13c   boundary-controller-1   hashicorp/boundary:0.21.0
c853b0f8967b   boundary-grafana-1      grafana/grafana
7ff1c3c0065b   boundary-prometheus-1   prom/prometheus
2301e8bf7f86   boundary-db-1           postgres
b41f9279ae91   boundary-postgres-1     postgres
The next part of this tutorial focuses on the relationship between the controller, worker, the Prometheus metrics server, and Grafana.
Enable metrics
You configure both the controller and worker instances to report metrics at
their /metrics endpoint.
To enable metrics, define a tcp listener with the "ops" purpose in
the server configuration file:
listener "tcp" {
    purpose = "ops"
    tls_disable = true
}
This example is the minimum needed to enable metrics. To expose the /metrics
endpoint to Prometheus, a port should be specified in the listener configuration
as well.
Open the controller configuration file, compose/controller.hcl. Uncomment
lines 29 - 33.
compose/controller.yml
# Copyright (c) HashiCorp, Inc.
# SPDX-License-Identifier: MPL-2.0

disable_mlock = true

controller {
  name = "docker-controller"
  description = "A controller for a docker demo!"
  address = "boundary"
  database {
      url = "env://BOUNDARY_PG_URL"
  }
}

listener "tcp" {
  address = "0.0.0.0:9200"
  purpose = "api"
  tls_disable = true
  cors_enabled = true
  cors_allowed_origins = ["*"]
}

listener "tcp" {
  address = "boundary:9201"
  purpose = "cluster"
  tls_disable = true
}

listener "tcp" {
  address = "0.0.0.0:9203"
  purpose = "ops"
  tls_disable = true
}

kms "aead" {
  purpose = "root"
  aead_type = "aes-gcm"
  key = "sP1fnF5Xz85RrXyELHFeZg9Ad2qt4Z4bgNHVGtD6ung="
  key_id = "global_root"
}

kms "aead" {
  purpose = "worker-auth"
  aead_type = "aes-gcm"
  key = "8fZBjCUfN0TzjEGLQldGY4+iE9AkOvCfjh7+p0GtRBQ="
  key_id = "global_worker-auth"
}

kms "aead" {
  purpose = "recovery"
  aead_type = "aes-gcm"
  key = "8fZBjCUfN0TzjEGLQldGY4+iE9AkOvCfjh7+p0GtRBQ="
  key_id = "global_recovery"
}
Adding this listener block to a Boundary server will enable metrics collection
at the address 0.0.0.0:9203. Save this file.
In the compose/docker-compose.yml file, notice that the controller container
maps port 9203 to the localhost's 9203.
compose/docker-compose.yml
  controller:
    image: hashicorp/boundary:latest-0c8dd578e
    entrypoint: sh -c "sleep 3 && exec boundary server -config /boundary/controller.hcl -log-level debug"
    volumes:
      - "${PWD}/:/boundary/"
    hostname: boundary
    ports:
      - "9200:9200"
      - "9201:9201"
      - "9203:9203"
    environment:
      - HOSTNAME=boundary
      - BOUNDARY_PG_URL=postgresql://postgres:postgres@db/boundary?sslmode=disable
    depends_on:
      - db-init
      - prometheus
    networks:
      - default
      - worker
With this configuration in place, restart the controller.
$ docker restart boundary-controller-1
boundary-controller-1
Open your web browser, and visit http://localhost:9203/metrics. You will find
a list of controller metrics, similar to what the boundary dev server showed
at this endpoint earlier.
Unlike in dev mode, the controller includes controller-related metrics, and other Go-related metrics, including:
boundary_controller_api_http_request_duration_secondboundary_controller_api_http_request_size_bytesboundary_controller_api_http_response_size_bytesboundary_controller_cluster_grpc_request_duration_seconds
Next, follow the same procedure to enable metrics on the worker.
Open the worker configuration file, compose/worker.hcl. Uncomment lines 14 -
18.
compose/worker.yml
# Copyright (c) HashiCorp, Inc.
# SPDX-License-Identifier: MPL-2.0

// compose/worker.hcl

disable_mlock = true

listener "tcp" {
  address = "worker"
  purpose = "proxy"
  tls_disable = true
}

listener "tcp" {
  address = "0.0.0.0:9203"
  purpose = "ops"
  tls_disable = true
}

worker {
  name = "worker"
  description = "A worker for a docker demo"
  address     = "worker"
  public_addr = "127.0.0.1:9202"
  controllers = ["boundary:9201"]
}

kms "aead" {
  purpose = "worker-auth"
  aead_type = "aes-gcm"
  key = "8fZBjCUfN0TzjEGLQldGY4+iE9AkOvCfjh7+p0GtRBQ="
  key_id = "global_worker-auth"
}
Adding this listener block to a Boundary server will enable metrics collection
at the address 0.0.0.0:9203. Save this file.
In the compose/docker-compose.yml file, notice that the worker container
maps port 9203 to the localhost's 9204. This is to prevent a port collision
on 9203, where the controller reports its metrics.
compose/docker-compose.yml
  worker:
    image:  hashicorp/boundary:latest-0c8dd578e
    command: ["server", "-config", "/boundary/worker.hcl", "-log-level", "debug"]
    volumes:
      - "${PWD}/:/boundary/"
    hostname: worker
    ports:
      - "9202:9202"
      - "9204:9203"
    environment:
      - HOSTNAME=worker
    depends_on:
      - controller
    networks:
      - default
      - worker
With this configuration in place, restart the worker.
$ docker restart boundary-worker-1
boundary-worker-1
Open your web browser, and visit http://localhost:9204/metrics. You will find
a list of worker metrics. Similar to the controller, the metrics reported
contain worker and Go related metrics:
boundary_cluster_client_grpc_request_duration_secondsboundary_worker_proxy_http_write_header_duration_secondsboundary_worker_proxy_websocket_active_connectionsboundary_worker_proxy_websocket_sent_bytes
Configure Prometheus
With metrics enabled on the controller and worker servers, you can configure Prometheus.
Open the compose/prometheus.yml configuration file. This tutorial pre-defines
the Prometheus jobs under the scrape_configs section:
compose/prometheus.yml
# my global config
global:
  scrape_interval: 15s # Set the scrape interval to every 15 seconds. Default is every 1 minute.
  evaluation_interval: 15s # Evaluate rules every 15 seconds. The default is every 1 minute.
  # scrape_timeout is set to the global default (10s).

# Alertmanager configuration
alerting:
  alertmanagers:
    - static_configs:
        - targets:
          # - alertmanager:9093

# Load rules once and periodically evaluate them according to the global 'evaluation_interval'.
rule_files:
  # - "first_rules.yml"
  # - "second_rules.yml"

# A scrape configuration containing exactly one endpoint to scrape:
# Here it's Prometheus itself.
scrape_configs:
  # The job name is added as a label `job=<job_name>` to any timeseries scraped from this config.
  - job_name: "prometheus"

    # metrics_path defaults to '/metrics'
    # scheme defaults to 'http'.

    static_configs:
      - targets: ["localhost:9090"]

  - job_name: "controller"

    static_configs:
      - targets: ["boundary:9203"]

  - job_name: "worker"

    static_configs:
      - targets: ["worker:9203"]
Prometheus collects metrics about itself on localhost:9090.
For the controller job, Prometheus listens on the boundary host at port
9203. Similarly, the worker job listens on the worker host at port 9203.
Remember that the Prometheus container is within the Docker Compose deployment,
so it is listening on the host's exposed ops port, not the forwarded port on
your machine's localhost.
This configuration is already correct. Open your web browser and navigate to
http://localhost:9090 to view the Prometheus dashboard.
This dashboard is the same as when you deployed Prometheus locally earlier when
running boundary dev. Check that various boundary_controller_ and
boundary_worker_ metrics are available within the Expression search box.
Execute a query for the controller and worker to ensure metrics are properly
enabled.
With Prometheus collecting and reporting metrics, you can deploy a more robust visualization tool to explore Boundary metrics.
Configure Grafana
Grafana is an observability tool commonly integrated with Prometheus. The tool enables a more robust view of metrics than can be created using Prometheus alone.
This tutorial uses the Grafana Docker
image, but you can also use Grafana
Cloud using a remote_write
block added to the
compose/prometheus.yml file.
Examine the Grafana configuration on lines 85 - 95 in the
compose/docker-compose.yml file.
compose/docker-compose.yml
grafana:
  image: grafana/grafana
  volumes:
    - "${PWD}/datasource.yml:/etc/grafana/provisioning/datasources/prometheus_datasource.yml"
  hostname: grafana
  ports:
    - "3000:3000"
  depends_on:
    - prometheus
  networks:
    - default
The compose/datasource.yml file is copied to the grafana container into
/etc/grafana/provisioning/datasources/, the default config directory for
Grafana. When Grafana is started it automatically loads this file.
The grafana container maps to port 3000 on your localhost.
Open compose/datasource.yml.
compose/datasource.yml
# Copyright (c) HashiCorp, Inc.
# SPDX-License-Identifier: MPL-2.0

# config file version
apiVersion: 1

datasources:
- name: boundary
  type: prometheus
  access: server
  orgId: 1
  url: http://prometheus:9090
  password:
  user:
  database:
  basicAuth:
  basicAuthUser:
  basicAuthPassword:
  withCredentials:
  isDefault:
  jsonData:
     graphiteVersion: "1.1"
     tlsAuth: false
     tlsAuthWithCACert: false
  secureJsonData:
    tlsCACert: ""
    tlsClientCert: ""
    tlsClientKey: ""
  version: 1
  editable: true
This basic Grafana configuration specifies a datasource named boundary, of
type prometheus. The url: http://prometheus:9090 specifies the default
location where Prometheus is running, and serves as the source of metrics for
Grafana.
This configuration is already correct. Open your web browser and navigate to
http://localhost:3000 to view the Grafana dashboard.

Login using the default Grafana credentials:
- Email or username:
admin - Password:
admin
Skip the prompt to create a new password to continue to the dashboard.
Examine graph metrics
From the Grafana Home, expand Connections and click Data Sources. If you do not see the left navigation menu, click the hamburger menu in the top left next to the Grafana icon.

Grafana displays the boundary data source supplied as part of
datasource.yml. If there is no boundary data source, review your local
compose/datasource.yml file against the version in the GitHub repository.

Click on the boundary data source to view its settings.

The Name, Type, and Connection come from the datasource configuration file.
# config file version
apiVersion: 1

datasources:
- name: boundary
  type: prometheus
  access: server
  orgId: 1
  url: http://prometheus:9090
...snip...
With Grafana running, you can now build a dashboard for the Boundary deployment.
Click Dashboards in the left navigation menu. Click New and select Import dashboard.
A sample dashboard compiling the controller and worker metrics has been provided
for this tutorial in the
learn-boundary-prometheus-metrics-dev/compose/Boundary-Overview-Dashboard.json
file.
Next, click Upload dashboard JSON file and select the
learn-boundary-prometheus-metrics-dev/compose/Boundary-Overview-Dashboard.json
file.
Click on Select a Prometheus data source and select boundary. When finished, click Import.
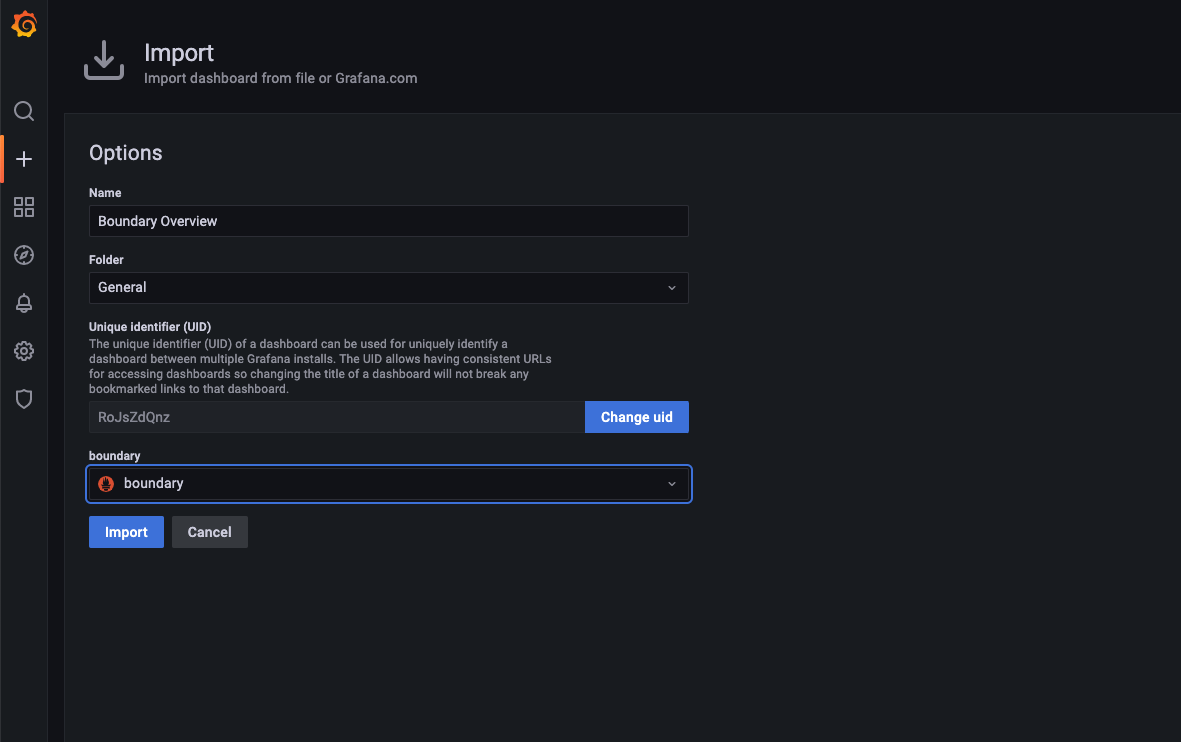
You will be redirected to the imported Boundary Overview dashboard. The relevant Boundary metrics have been organized into panels that overlay common renderings of the same metric value, such as the panel:
boundary_controller_api_http_request_duration_seconds
boundary_controller_api_http_request_duration_seconds_bucketboundary_controller_api_http_request_duration_seconds_countboundary_controller_api_http_request_duration_seconds_sum
Return to a terminal session and proceed to make various queries and requests to
Boundary. You will need the user1 auth_method_id from deploying the lab
environment to authenticate. The user1 password is
password.
$ boundary authenticate password -login-name user1
Please enter the password (it will be hidden): <password>

Authentication information:
  Account ID:      acctpw_vuC8ttaT7q
  Auth Method ID:  ampw_3c0u8u2wsv
  Expiration Time: Thu, 28 Apr 2022 19:03:48 MDT
  User ID:         u_lLN5ajmjjR

The token was successfully stored in the chosen keyring and is not displayed here.
Next, examine the Boundary deployment by querying for various resources, such as listing targets and reading target details.
$ boundary targets list -recursive

Target information:
  ID:                    ttcp_OVdplA2NOD
    Scope ID:            p_4zconn633N
    Version:             2
    Type:                tcp
    Name:                postgres
    Description:         postgres server
    Authorized Actions:
      no-op
      read
      update
      delete
      add-host-sources
      set-host-sources
      remove-host-sources
      add-credential-libraries
      set-credential-libraries
      remove-credential-libraries
      add-credential-sources
      set-credential-sources
      remove-credential-sources
      authorize-session

  ID:                    ttcp_4AvJDpwe5C
    Scope ID:            p_4zconn633N
    Version:             2
    Type:                tcp
    Name:                ssh
    Description:         SSH server
    Authorized Actions:
      no-op
      read
      update
      delete
      add-host-sources
      set-host-sources
      remove-host-sources
      add-credential-libraries
      set-credential-libraries
      remove-credential-libraries
      add-credential-sources
      set-credential-sources
      remove-credential-sources
      authorize-session

  ID:                    ttcp_LBkMY9JVbI
    Scope ID:            p_4zconn633N
    Version:             2
    Type:                tcp
    Name:                boundary-db
    Description:         Boundary Postgres server
    Authorized Actions:
      no-op
      read
      update
      delete
      add-host-sources
      set-host-sources
      remove-host-sources
      add-credential-libraries
      set-credential-libraries
      remove-credential-libraries
      add-credential-sources
      set-credential-sources
      remove-credential-sources
      authorize-session
After interacting with Boundary, return to the Grafana dashboard. You will notice various metrics reported and graphed over time as more are available.

Examine health check endpoint
Boundary also includes a health check endpoint for the controller.
Like metrics, the health endpoint uses a listener with the "ops"
purpose defined, by default on port 9203. This configuration enables the
/health endpoint where you can monitor the controller's overall status.
Health checks are critical for load-balanced Boundary deployments, and situations where Boundary needs a shutdown grace period.
The controller health service uses a single read-only endpoint:
| Status | Description |
|---|---|
200 | GET /health returns HTTP status 200 OK if the controller's api gRPC Server is up |
5xx | GET /health returns HTTP status 5XX or request timeout if unhealthy |
503 | GET /health returns HTTP status 503 Service Unavailable status if the controller is shutting down |
All responses return empty bodies. GET /health does not support any input.
Querying this in a terminal session using curl, Invoke-WebRequest or wget
returns a 200 response when the controller is healthy.
$ curl -i http://localhost:9203/health
HTTP/1.1 200 OK
Cache-Control: no-store
Content-Type: application/json
Grpc-Metadata-Content-Type: application/grpc
Date: Wed, 26 Aug 2026 13:43:28 GMT
Content-Length: 2
Cleanup and teardown
The Boundary cluster containers and network resources can be cleaned up
using the provided deploy script.
$ ./deploy cleanup
~/target-aware-workers/compose ~/target-aware-workers
~/learn-boundary-prometheus-metrics-dev/compose ~/learn-boundary-prometheus-metrics-dev
Stopping boundary_worker_1     ... done
Stopping boundary_controller_1 ... done
Stopping boundary_grafana_1    ... done
Stopping boundary_prometheus_1 ... done
Stopping boundary_db_1         ... done
Stopping boundary_postgres_1   ... done
Going to remove boundary_worker_1, boundary_controller_1, boundary_db-init_1, boundary_grafana_1, boundary_prometheus_1, boundary_db_1, boundary_postgres_1
Removing boundary_worker_1     ... done
Removing boundary_controller_1 ... done
Removing boundary_db-init_1    ... done
Removing boundary_grafana_1    ... done
Removing boundary_prometheus_1 ... done
Removing boundary_db_1         ... done
Removing boundary_postgres_1   ... done
~/learn-boundary-prometheus-metrics-dev
~/learn-boundary-prometheus-metrics-dev/terraform ~/learn-boundary-prometheus-metrics-dev
~/learn-boundary-prometheus-metrics-dev
Check your work with a quick docker ps and ensure there are no more containers
with the boundary_ prefix leftover. If unexpected containers still exist,
execute docker rm -f CONTAINER_NAME against each to remove them.