Event filtering and sink configuration
Boundary increases observability by allowing for fine-grained visibility when managing Boundary clusters. System information can be logged in a well-defined, structured format that provides operators increased visibility into emitted events.
When enabled, event logs are the only type of logging Boundary performs, and
standard system information and debug logs will no longer appear in stdout.
Event logs are filterable by event type and other defined expressions, although
HCLog output is still currently available.
This tutorial demonstrates the basics of how to define and configure a logging event sink, and then visualize events using Elasticsearch and Kibana.
Prerequisites
This tutorial assumes that you understand how to Start a Development Environment.
Docker is installed
Docker-Compose is installed
A Boundary binary greater than 0.15.0 in your
PATHTerraform 0.13.0 or greater in your
PATH
Logging in Dev mode
Boundary can be started in dev mode using the -event-allow-filter option to
specify what kinds of events should be logged. It is important to know what
kinds of events are emitted by Boundary in order to know what should be logged.
For example, requests to the "/data/request_info/path" endpoint that contain
":authenticate" reference authentication events. Requests to the "/data/op"
endpoint that contain ".createClientConn" reference client connection events.
boundary dev can be started with these pre-configured event sinks like this:
$ boundary dev \
    -event-allow-filter '"/data/request_info/path" contains ":authenticate"' \
    -event-allow-filter '"/data/op" contains ".createClientConn"'
These events are then emitted to stdout. By default, boundary dev logs all
events to stdout, unless otherwise specified using -event-allow-filter.
Get Setup
The lab environment for this tutorial uses Docker Compose to deploy these containers:
- Boundary controller server
- Boundary worker server
- Boundary Postgres database
- Elasticsearch
- Kibana
- Filebeat
- A Postgres target
This tutorial includes an "ELK" stack (or really a EFK stack) with:
- elasticsearch for persisting and searching event logs
- filebeat to collect and send event logs to elasticsearch
- kibana to visualize events
To learn more about the various Boundary components, refer back to the Start a Development Environment tutorial.
Deploy the lab environment
Download or clone the lab environment from the following Github repository:
In your terminal, clone the repository to get the example files locally:
$ git clone git@github.com:hashicorp-education/learn-boundary-event-logging.gitMove into the
learn-boundary-event-loggingfolder.$ cd learn-boundary-event-loggingEnsure that you are in the correct directory by listing its contents.
$ ls -R1
README.md
auditlogs
compose
deploy
filebeat.docker.yml
postgres
terraform

./auditlogs:

./compose:
controller.hcl
docker-compose.yml
worker.hcl

./postgres:
postgresql.conf

./terraform:
main.tf
outputs.tf
versions.tf
The repository contains the following files:
auditlogs/: A shared directory for log files.deploy: A script used to deploy and tear down the Docker-Compose configuration.filebeat.docker.yml: The filbeat config for sending event logs to elasticsearchcompose/docker-compose.yml: The Docker-Compose configuration file describing how to provision and network the boundary cluster.compose/controller.hcl: The controller configuration file.compose/worker.hcl: The worker configuration file.postgres/postgresql.conf: The Boundary database config file.terraform/main.tf: The terraform provisioning instructions using the Boundary provider.
This tutorial makes it easy to launch the test environment with the
deployscript.$ ./deploy all ~/learn-boundary-event-logging/compose ~/learn-boundary-event-logging [+] Running 9/9 ✔ Container boundary-filebeat-1 Started 0.3s ✔ Container boundary-setup-elastic-1 Healthy 1.8s ✔ Container boundary-db-1 Healthy 3.8s ✔ Container boundary-postgres-1 Started 0.3s ✔ Container boundary-elasticsearch-1 Healthy 12.4s ✔ Container boundary-db-init-1 Started 3.8s ✔ Container boundary-kibana-1 Started 12.5s ✔ Container boundary-controller-1 Healthy 14.4s ✔ Container boundary-worker-1 Started 14.5s ~/learn-boundary-event-logging ~/learn-boundary-event-logging/terraform ~/learn-boundary-event-logging Initializing the backend... Initializing provider plugins... - Finding hashicorp/boundary versions matching "1.1.15"... - Installing hashicorp/boundary v1.1.15... - Installed hashicorp/boundary v1.1.15 (signed by HashiCorp) Terraform has created a lock file .terraform.lock.hcl to record the provider selections it made above. Include this file in your version control repository so that Terraform can guarantee to make the same selections by default when you run "terraform init" in the future. Terraform has been successfully initialized! You may now begin working with Terraform. Try running "terraform plan" to see any changes that are required for your infrastructure. All Terraform commands should now work. If you ever set or change modules or backend configuration for Terraform, rerun this command to reinitialize your working directory. If you forget, other commands will detect it and remind you to do so if necessary. Terraform used the selected providers to generate the following execution plan. Resource actions are indicated with the following symbols: + create Terraform will perform the following actions: # boundary_account_password.user["user1"] will be created + resource "boundary_account_password" "user" { + auth_method_id = (known after apply) + description = "User account for user1" + id = (known after apply) + login_name = "user1" + name = "user1" + password = (sensitive value) + type = "password" } # boundary_auth_method.password will be created + resource "boundary_auth_method" "password" { + description = "Password auth method for org" + id = (known after apply) + min_login_name_length = (known after apply) + min_password_length = (known after apply) + name = "org_password_auth" + scope_id = (known after apply) + type = "password" } # boundary_host_catalog_static.databases will be created + resource "boundary_host_catalog_static" "databases" { + description = "Database targets" + id = (known after apply) + name = "databases" + scope_id = (known after apply) } # boundary_host_set_static.local will be created + resource "boundary_host_set_static" "local" { + description = "Host set for local servers" + host_catalog_id = (known after apply) + host_ids = (known after apply) + id = (known after apply) + name = "local" + type = "static" } # boundary_host_set_static.postgres will be created + resource "boundary_host_set_static" "postgres" { + description = "Host set for postgres containers" + host_catalog_id = (known after apply) + host_ids = (known after apply) + id = (known after apply) + name = "postgres" + type = "static" } # boundary_host_static.localhost will be created + resource "boundary_host_static" "localhost" { + address = "localhost" + description = "Localhost host" + host_catalog_id = (known after apply) + id = (known after apply) + name = "localhost" + type = "static" } # boundary_host_static.postgres will be created + resource "boundary_host_static" "postgres" { + address = "postgres" + description = "Private postgres container" + host_catalog_id = (known after apply) + id = (known after apply) + name = "postgres" + type = "static" } # boundary_role.global_anon_listing will be created + resource "boundary_role" "global_anon_listing" { + grant_scope_id = (known after apply) + grant_scope_ids = (known after apply) + grant_strings = [ + "ids=*;type=auth-method;actions=list,authenticate", + "ids={{account.id}};actions=read,change-password", + "type=scope;actions=list", ] + id = (known after apply) + principal_ids = [ + "u_anon", ] + scope_id = (known after apply) } # boundary_role.org_admin will be created + resource "boundary_role" "org_admin" { + grant_scope_id = (known after apply) + grant_scope_ids = (known after apply) + grant_strings = [ + "ids=*;type=*;actions=*", ] + id = (known after apply) + principal_ids = (known after apply) + scope_id = "global" } # boundary_role.org_anon_listing will be created + resource "boundary_role" "org_anon_listing" { + grant_scope_id = (known after apply) + grant_scope_ids = (known after apply) + grant_strings = [ + "ids=*;type=auth-method;actions=list,authenticate", + "ids={{account.id}};actions=read,change-password", + "type=scope;actions=list", ] + id = (known after apply) + principal_ids = [ + "u_anon", ] + scope_id = (known after apply) } # boundary_role.proj_admin will be created + resource "boundary_role" "proj_admin" { + grant_scope_id = (known after apply) + grant_scope_ids = (known after apply) + grant_strings = [ + "ids=*;type=*;actions=*", ] + id = (known after apply) + principal_ids = (known after apply) + scope_id = (known after apply) } # boundary_scope.global will be created + resource "boundary_scope" "global" { + global_scope = true + id = (known after apply) + name = "global" + scope_id = "global" } # boundary_scope.org will be created + resource "boundary_scope" "org" { + description = "Primary organization scope" + id = (known after apply) + name = "primary" + scope_id = (known after apply) } # boundary_scope.project will be created + resource "boundary_scope" "project" { + auto_create_admin_role = true + auto_create_default_role = true + description = "Databases project" + id = (known after apply) + name = "databases" + scope_id = (known after apply) } # boundary_target.db will be created + resource "boundary_target" "db" { + default_port = 5432 + description = "Boundary Postgres server" + host_source_ids = (known after apply) + id = (known after apply) + name = "boundary-db" + scope_id = (known after apply) + session_connection_limit = -1 + session_max_seconds = 2 + type = "tcp" } # boundary_target.postgres will be created + resource "boundary_target" "postgres" { + default_port = 5432 + description = "postgres server" + host_source_ids = (known after apply) + id = (known after apply) + name = "postgres" + scope_id = (known after apply) + session_connection_limit = -1 + session_max_seconds = 300 + type = "tcp" } # boundary_target.ssh will be created + resource "boundary_target" "ssh" { + default_port = 22 + description = "SSH server" + host_source_ids = (known after apply) + id = (known after apply) + name = "ssh" + scope_id = (known after apply) + session_connection_limit = -1 + session_max_seconds = 2 + type = "tcp" } # boundary_user.user["user1"] will be created + resource "boundary_user" "user" { + account_ids = (known after apply) + description = "User resource for user1" + id = (known after apply) + name = "user1" + scope_id = (known after apply) } Plan: 18 to add, 0 to change, 0 to destroy. Changes to Outputs: + username = (sensitive value) boundary_scope.global: Creating... boundary_scope.global: Creation complete after 0s [id=global] boundary_scope.org: Creating... boundary_role.global_anon_listing: Creating... boundary_scope.org: Creation complete after 0s [id=o_24gwdKz7Oh] boundary_auth_method.password: Creating... boundary_scope.project: Creating... boundary_role.org_anon_listing: Creating... boundary_scope.project: Creation complete after 0s [id=p_pj6UUPVJT3] boundary_host_catalog_static.databases: Creating... boundary_auth_method.password: Creation complete after 0s [id=ampw_f9LSI9eqCK] boundary_account_password.user["user1"]: Creating... boundary_host_catalog_static.databases: Creation complete after 1s [id=hcst_zT12Izrq5p] boundary_host_static.localhost: Creating... boundary_host_static.postgres: Creating... boundary_account_password.user["user1"]: Creation complete after 1s [id=acctpw_XSaUgTBueH] boundary_user.user["user1"]: Creating... boundary_role.global_anon_listing: Creation complete after 1s [id=r_bRFwA4pOO8] boundary_host_static.localhost: Creation complete after 0s [id=hst_zmYBCgpmWX] boundary_host_set_static.local: Creating... boundary_host_static.postgres: Creation complete after 1s [id=hst_W7Sj8v6At6] boundary_host_set_static.postgres: Creating... boundary_user.user["user1"]: Creation complete after 2s [id=u_25B8ISMonM] boundary_role.org_admin: Creating... boundary_role.proj_admin: Creating... boundary_host_set_static.local: Creation complete after 2s [id=hsst_xNtrSMppW7] boundary_target.ssh: Creation complete after 2s [id=ttcp_21RDhgSk4S] boundary_target.db: Creation complete after 2s [id=ttcp_vwnxnr4fXC] boundary_target.postgres: Creation complete after 2s [id=ttcp_trexhb5PRQ] boundary_role.org_admin: Creation complete after 4s [id=r_o2llqO0n4f] boundary_role.proj_admin: Creation complete after 4s [id=r_S0N4CsoVGP] Apply complete! Resources: 18 added, 0 changed, 0 destroyed. Outputs: username = <sensitive>Any resource deprecation warnings in the output can safely be ignored.
The user details are a sensitive Terraform output. You can check the
terraform/terraform.tfstatefile to find its value, or execute the following command:$ pushd terraform/ ; terraform output -json ; popd ~/learn-boundary-event-logging/terraform ~/learn-boundary-event-logging { "username": { "sensitive": true, "type": [ "object", { "user1": [ "object", { "auth_method_id": "string", "description": "string", "id": "string", "login_name": "string", "name": "string", "password": "string", "type": "string" } ] } ], "value": { "user1": { "auth_method_id": "ampw_f9LSI9eqCK", "description": "User account for user1", "id": "acctpw_XSaUgTBueH", "login_name": "user1", "name": "user1", "password": "password", "type": "password" } } } }You will need the user1
auth_method_idto authenticate via the CLI and establish sessions later on. Export this value as an environment variable:$ export BOUNDARY_AUTH_METHOD_ID=ampw_f9LSI9eqCKYou can tear down the environment at any time by executing
./deploy cleanup.To verify that the environment deployed correctly, print the running docker containers in the
boundarydeployment.First, export the Docker Compose project name,
boundary, as an environment variable.$ export COMPOSE_PROJECT_NAME=boundaryThen print the containers created using Compose.
$ docker compose ps
NAME                       IMAGE                                                 COMMAND                  SERVICE         CREATED       STATUS                 PORTS
boundary-controller-1      hashicorp/boundary:0.17.1                             "sh -c 'sleep 5 && e…"   controller      5 hours ago   Up 5 hours (healthy)   0.0.0.0:9200-9201->9200-9201/tcp, 0.0.0.0:9203->9203/tcp, 9202/tcp
boundary-db-1              postgres                                              "docker-entrypoint.s…"   db              5 hours ago   Up 5 hours (healthy)   0.0.0.0:5432->5432/tcp
boundary-elasticsearch-1   docker.elastic.co/elasticsearch/elasticsearch:8.1.2   "/bin/tini -- /usr/l…"   elasticsearch   5 hours ago   Up 5 hours (healthy)   9300/tcp, 127.0.0.1:19200->9200/tcp
boundary-filebeat-1        docker.elastic.co/beats/filebeat:8.1.2                "/usr/bin/tini -- /u…"   filebeat        5 hours ago   Up 5 hours
boundary-kibana-1          docker.elastic.co/kibana/kibana:8.1.2                 "/bin/tini -- /usr/l…"   kibana          5 hours ago   Up 5 hours (healthy)   0.0.0.0:5601->5601/tcp
boundary-postgres-1        postgres                                              "docker-entrypoint.s…"   postgres        5 hours ago   Up 5 hours (healthy)   5432/tcp
boundary-worker-1          hashicorp/boundary:0.17.1                             "docker-entrypoint.s…"   worker          5 hours ago   Up 5 hours             9200-9201/tcp, 0.0.0.0:9202->9202/tcp
This tutorial will examine the configuration of event sink logs on the controller and worker containers.
Event sinks
An event sink is a location where events can be written to. Sinks can be configured to allow or deny event types using filter syntax.
Common event types include cloudevents and hclog, which can be encoded as text and json.
To better understand events, examine the stderr on the running controller
container by checking its logs.
$ docker compose logs controller
controller-1  | ==> Boundary server configuration:
controller-1  |
controller-1  |             [Recovery] Aead Type: aes-gcm
controller-1  |                 [Root] Aead Type: aes-gcm
controller-1  |          [Worker-Auth] Aead Type: aes-gcm
controller-1  |                              Cgo: disabled
controller-1  |   Controller Public Cluster Addr: boundary:9201
controller-1  |                       Listener 1: tcp (addr: "0.0.0.0:9200", cors_allowed_headers: "[]", cors_allowed_origins: "[*]", cors_enabled: "true", max_request_duration: "1m30s", purpose: "api")
controller-1  |                       Listener 2: tcp (addr: "boundary:9201", max_request_duration: "1m30s", purpose: "cluster")
controller-1  |                       Listener 3: tcp (addr: "0.0.0.0:9203", max_request_duration: "1m30s", purpose: "ops")
controller-1  |                        Log Level: info
controller-1  |                            Mlock: supported: true, enabled: false
controller-1  |                          Version: Boundary v0.17.1
controller-1  |                      Version Sha: 6851256561b50778eae55144cc6e5be96ce23232
controller-1  |
controller-1  | ==> Boundary server started! Log data will stream in below:
controller-1  |
controller-1  | {"id":"P0pzwpJGvO","source":"https://hashicorp.com/boundary/boundary/controller","specversion":"1.0","type":"system","data":{"version":"v0.1","op":"scheduler.(Scheduler).monitorJobs","data":{"interrupt threshold":"5m0s","monitor interval":"30s","msg":"monitor loop running","server id":"docker-controller"}},"datacontentype":"application/cloudevents","time":"2024-08-30T17:50:08.963146049Z"}
controller-1  | {"id":"hSAMUhdcZb","source":"https://hashicorp.com/boundary/boundary/controller","specversion":"1.0","type":"system","data":{"version":"v0.1","op":"controller.(rateLimiterConfig).writeSysEvent","data":{"limits":{"account":{"change-password":[{"resource":"account","action":"change-password","per":"auth-token","unlimited":false,"limit":3000,"period":"30s"},{"resource":"account","action":"change-password","per":"ip-address","unlimited":false,"limit":30000,"period":"30s"},{"resource":"account","action":"change-password","per":"total","unlimited":false,"limit":30000,"period":"30s"}],"create":[{"resource":"account","action":"create","per":"ip-address","unlimited":false,"limit":30000,"period":"30s"},{"resource":"account","action":"create","per":"auth-token","unlimited":false,"limit":3000,"period":"30s"},{"resource":"account","action":"create","per":"total","unlimited":false,"limit":30000,"period":"30s"}],"delete":[{"resource":"account","action":"delete","per":"total","unlimited":false,"limit":30000,"period":"30s"},{"resource":"account","action":"delete","per":"auth-token","unlimited":false,"limit":3000,"period":"30s"},{"resource":"account","action":"delete","per":"ip-address","unlimited":false,"limit":30000,"period":"30s"}],"list":[{"resource":"account","action":"list","per":"total","unlimited":false,"limit":1500,"period":"30s"},{"resource":"account","action":"list","per":"ip-address","unlimited":false,"limit":1500,"period":"30s"},{"resource":"account","action":"list","per":"auth-token","unlimited":false,"limit":150,"period":"30s"}],"no-op":[{"resource":"account","action":"no-op","per":"auth-token","unlimited":false,"limit":3000,"period":"30s"},{"resource":"account","action":"no-op","per":"total","unlimited":false,"limit":30000,"period":"30s"},{"resource":"account","action":"no-op","per":"ip-address","unlimited":false,"limit":30000,"period":"30s"}],"read":[{"resource":"account","action":"read","per":"auth-token","unlimited":false,"limit":3000,"period":"30s"},{"resource":"account","action":"read","per":"ip-address","unlimited":false,"limit":30000,"period":"30s"},{"resource":"account","action":"read","per":"total","unlimited":false,"limit":30000,"period":"30s"}],"set-password":[{"resource":"account","action":"set-password","per":"auth-token","unlimited":false,"limit":3000,"period":"30s"},{"resource":"account","action":"set-password","per":"total","unlimited":false,"limit":30000,"period":"30s"},{"resource":"account","action":"set-password","per":"ip-address","unlimited":false,"limit":30000,"period":"30s"}],"update":[{"resource":"account","action":"update","per":"auth-token","unlimited":false,"limit":3000,"period":"30s"},{"resource":"account","action":"update","per":"total","unlimited":false,"limit":30000,"period":"30s"},{"resource":"account","action":"update","per":"ip-address","unlimited":false,"limit":30000,"period":"30s"}]},"alias":{"create":[{"resource":"alias","action":"create","per":"total","unlimited":false,"limit":30000,"period":"30s"},{"resource":"alias","action":"create","per":"ip-address","unlimited":false,"limit":30000,"period":"30s"},{"resource":"alias","action":"create","per":"auth-token","unlimited":false,"limit":3000,"period":"30s"}],"delete":[{"resource":"alias","action":"delete","per":"total","unlimited":false,"limit":30000,"period":"30s"},{"resource":"alias","action":"delete","per":"ip-address","unlimited":false,"limit":30000,"period":"30s"},{"resource":"alias","action":"delete","per":"auth-token","unlimited":false,"limit":3000,"period":"30s"}],"list":[{"resource":"alias","action":"list","per":"ip-address","unlimited":false,"limit":1500,"period":"30s"},{"resource":"alias","action":"list","per":"total","unlimited":false,"limit":1500,"period":"30s"},{"resource":"alias","action":"list","per":"auth-token","unlimited":false,"limit":150,"period":"30s"}],"no-op":[{"resource":"alias","action":"no-op","per":"auth-token","unlimited":false,"limit":3000,"period":"30s"},{"resource":"alias","action":"no-op","per":"ip-address","unlimited":false,"limit":30000,"period":"30s"},{"resource":"alias","action":"no-op","per":"total","unlimited":false,"limit":30000,"period":"30s"}],"read":[{"resource":"alias","action":"read","per":"ip-address","unlimited":false,"limit":30000,"period":"30s"},{"resource":"alias","action":"read","per":"auth-token","unlimited":false,"limit":3000,"period":"30s"},{"resource":"alias","action":"read","per":"total","unlimited":false,"limit":30000,"period":"30s"}],"update":[{"resource":"alias","action":"update","per":"auth-token","unlimited":false,"limit":3000,"period":"30s"},{"resource":"alias","action":"update","per":"ip-address","unlimited":false,"limit":30000,"period":"30s"},{"resource":"alias","action":"update","per":"total","unlimited":false,"limit":30000,"period":"30s"}]},"auth-method":{"authenticate":[{"resource":"auth-method","action":"authenticate","per":"total","unlimited":false,"limit":30000,"period":"30s"},{"resource":"auth-method","action":"authenticate","per":"auth-token","unlimited":false,"limit":3000,"period":"30s"},{"resource":"auth-method","action":"authenticate","per":"ip-address","unlimited":false,"limit":30000,"period":"30s"}],"change-state":[{"resource":"auth-method","action":"change-state","per":"auth-token","unlimited":false,"limit":3000,"period":"30s"},{"resource":"auth-method","action":"change-state","per":"total","unlimited":false,"limit":30000,"period":"30s"},{"resource":"auth-method","action":"change-state","per":"ip-address","unlimited":false,"limit":30000,"period":"30s"}],"create":[{"resource":"auth-method","action":"create","per":"ip-address","unlimited":false,"limit":30000,"period":"30s"},{"resource":"auth-method","action":"create","per":"auth-token","unlimited":false,"limit":3000,"period":"30s"},{"resource":"auth-method","action":"create","per":"total","unlimited":false,"limit":30000,"period":"30s"}],"delete":[{"resource":"auth-method","action":"delete","per":"ip-address","unlimited":false,"limit":30000,"period":"30s"},{"resource":"auth-method","action":"delete","per":"auth-token","unlimited":false,"limit":3000,"period":"30s"},{"resource":"auth-method","action":"delete","per":"total","unlimited":false,"limit":30000,"period":"30s"}],"list":[{"resource":"auth-method","action":"list","per":"auth-token","unlimited":false,"limit":150,"period":"30s"},{"resource":"auth-method","action":"list","per":"total","unlimited":false,"limit":1500,"period":"30s"},{"resource":"auth-method","action":"list","per":"ip-address","unlimited":false,"limit":1500,"period":"30s"}],"no-op":[{"resource":"auth-method","action":"no-op","per":"total","unlimited":false,"limit":30000,"period":"30s"},{"resource":"auth-method","action":"no-op","per":"auth-token","unlimited":false,"limit":3000,"period":"30s"},{"resource":"auth-method","action":"no-op","per":"ip-address","unlimited":false,"limit":30000,"period":"30s"}],"read":[{"resource":"auth-method","action":"read","per":"ip-address","unlimited":false,"limit":30000,"period":"30s"},{"resource":"auth-method","action":"read","per":"total","unlimited":false,"limit":30000,"period":"30s"},{"resource":"auth-method","action":"read","per":"auth-token","unlimited":false,"limit":3000,"period":"30s"}],"update":[{"resource":"auth-method","action":"update","per":"total","unlimited":false,"limit":30000,"period":"30s"},{"resource":"auth-method","action":"update","per":"auth-token","unlimited":false,"limit":3000,"period":"30s"},{"resource":"auth-method","action":"update","per":"ip-address","unlimited":false,"limit":30000,"period":"30s"}]},"auth-token":{"delete":[{"resource":"auth-token","action":"delete","per":"total","unlimited":false,"limit":30000,"period":"30s"},{"resource":"auth-token","action":"delete","per":"ip-address","unlimited":false,"limit":30000,"period":"30s"},{"resource":"auth-token","action":"delete","per":"auth-token","unlimited":false,"limit":3000,"period":"30s"}],"delete:self":[{"resource":"auth-token","action":"delete:self","per":"total","unlimited":false,"limit":30000,"period":"30s"},{"resource":"auth-token","action":"delete:self","per":"auth-token","unlimited":false,"limit":3000,"period":"30s"},{"resource":"auth-token","action":"delete:self","per":"ip-address","unlimited":false,"limit":30000,"period":"30s"}],"list":[{"resource":"auth-token","action":"list","per":"ip-address","unlimited":false,"limit":1500,"period":"30s"},{"resource":"auth-token","action":"list","per":"total","unlimited":false,"limit":1500,"period":"30s"},{"resource":"auth-token","action":"list","per":"auth-token","unlimited":false,"limit":150,"period":"30s"}],"no-op":[{"resource":"auth-token","action":"no-op","per":"auth-token","unlimited":false,"limit":3000,"period":"30s"},{"resource":"auth-token","action":"no-op","per":"total","unlimited":false,"limit":30000,"period":"30s"},{"resource":"auth-token","action":"no-op","per":"ip-address","unlimited":false,"limit":30000,"period":"30s"}],"read":[{"resource":"auth-token","action":"read","per":"ip-address","unlimited":false,"limit":30000,"period":"30s"},{"resource":"auth-token","action":"read","per":"total","unlimited":false,"limit":30000,"period":"30s"},{"resource":"auth-token","action":"read","per":"auth-token","unlimited":false,"limit":3000,"period":"30s"}],"read:self":[{"resource":"auth-token","action":"read:self","per":"total","unlimited":false,"limit":30000,"period":"30s"},{"resource":"auth-token","action":"read:self","per":"ip-address","unlimited":false,"limit":30000,"period":"30s"},{"resource":"auth-token","action":"read:self","per":"auth-token","unlimited":false,"limit":3000,"period":"30s"}]},"billing":{"monthly-active-users":[{"resource":"billing","action":"monthly-active-users","per":"total","unlimited":false,"limit":30000,"period":"30s"},{"resource":"billing","action":"monthly-active-users","per":"ip-address","unlimited":false,"limit":30000,"period":"30s"},{"resource":"billing","action":"monthly-active-users","per":"auth-token","unlimited":false,"limit":3000,"period":"30s"}]},"credential":{"create":[{"resource":"credential","action":"create","per":"total","unlimited":false,"limit":30000,"period":"30s"},{"resource":"credential","action":"create","per":"ip-address","unlimited":false,"limit":30000,"period":"30s"},{"resource":"credential","action":"create","per":"auth-token","unlimited":false,"limit":3000,"period":"30s"}],"delete":[{"resource":"credential","action":"delete","per":"total","unlimited":false,"limit":30000,"period":"30s"},{"resource":"credential","action":"delete","per":"auth-token","unlimited":false,"limit":3000,"period":"30s"},{"resource":"credential","action":"delete","per":"ip-address","unlimited":false,"limit":30000,"period":"30s"}],"list":[{"resource":"credential","action":"list","per":"auth-token","unlimited":false,"limit":150,"period":"30s"},{"resource":"credential","action":"list","per":"total","unlimited":false,"limit":1500,"period":"30s"},{"resource":"credential","action":"list","per":"ip-address","unlimited":false,"limit":1500,"period":"30s"}],"no-op":[{"resource":"credential","action":"no-op","per":"auth-token","unlimited":false,"limit":3000,"period":"30s"},{"resource":"credential","action":"no-op","per":"total","unlimited":false,"limit":30000,"period":"30s"},{"resource":"credential","action":"no-op","per":"ip-address","unlimited":false,"limit":30000,"period":"30s"}],"read":[{"resource":"credential","action":"read","per":"ip-address","unlimited":false,"limit":30000,"period":"30s"},{"resource":"credential","action":"read","per":"total","unlimited":false,"limit":30000,"period":"30s"},{"resource":"credential","action":"read","per":"auth-token","unlimited":false,"limit":3000,"period":"30s"}],"update":[{"resource":"credential","action":"update","per":"total","unlimited":false,"limit":30000,"period":"30s"},{"resource":"credential","action":"update","per":"ip-address","unlimited":false,"limit":30000,"period":"30s"},{"resource":"credential","action":"update","per":"auth-token","unlimited":false,"limit":3000,"period":"30s"}]},"credential-library":{"create":[{"resource":"credential-library","action":"create","per":"auth-token","unlimited":false,"limit":3000,"period":"30s"},{"resource":"credential-library","action":"create","per":"total","unlimited":false,"limit":30000,"period":"30s"},{"resource":"credential-library","action":"create","per":"ip-address","unlimited":false,"limit":30000,"period":"30s"}],"delete":[{"resource":"credential-library","action":"delete","per":"total","unlimited":false,"limit":30000,"period":"30s"},{"resource":"credential-library","action":"delete","per":"ip-address","unlimited":false,"limit":30000,"period":"30s"},{"resource":"credential-library","action":"delete","per":"auth-token","unlimited":false,"limit":3000,"period":"30s"}],"list":[{"resource":"credential-library","action":"list","per":"total","unlimited":false,"limit":1500,"period":"30s"},{"resource":"credential-library","action":"list","per":"auth-token","unlimited":false,"limit":150,"period":"30s"},{"resource":"credential-library","action":"list","per":"ip-address","unlimited":false,"limit":1500,"period":"30s"}],"no-op":[{"resource":"credential-library","action":"no-op","per":"ip-address","unlimited":false,"limit":30000,"period":"30s"},{"resource":"credential-library","action":"no-op","per":"total","unlimited":false,"limit":30000,"period":"30s"},{"resource":"credential-library","action":"no-op","per":"auth-token","unlimited":false,"limit":3000,"period":"30s"}],"read":[{"resource":"credential-library","action":"read","per":"total","unlimited":false,"limit":30000,"period":"30s"},{"resource":"credential-library","action":"read","per":"auth-token","unlimited":false,"limit":3000,"period":"30s"},{"resource":"credential-library","action":"read","per":"ip-address","unlimited":false,"limit":30000,"period":"30s"}],"update":[{"resource":"credential-library","action":"update","per":"ip-address","unlimited":false,"limit":30000,"period":"30s"},{"resource":"credential-library","action":"update","per":"total","unlimited":false,"limit":30000,"period":"30s"},{"resource":"credential-library","action":"update","per":"auth-token","unlimited":false,"limit":3000,"period":"30s"}]},"credential-store":{"create":[{"resource":"credential-store","action":"create","per":"ip-address","unlimited":false,"limit":30000,"period":"30s"},{"resource":"credential-store","action":"create","per":"auth-token","unlimited":false,"limit":3000,"period":"30s"},{"resource":"credential-store","action":"create","per":"total","unlimited":false,"limit":30000,"period":"30s"}],"delete":[{"resource":"credential-store","action":"delete","per":"auth-token","unlimited":false,"limit":3000,"period":"30s"},{"resource":"credential-store","action":"delete","per":"total","unlimited":false,"limit":30000,"period":"30s"},{"resource":"credential-store","action":"delete","per":"ip-address","unlimited":false,"limit":30000,"period":"30s"}],"list":[{"resource":"credential-store","action":"list","per":"ip-address","unlimited":false,"limit":1500,"period":"30s"},{"resource":"credential-store","action":"list","per":"auth-token","unlimited":false,"limit":150,"period":"30s"},{"resource":"credential-store","action":"list","per":"total","unlimited":false,"limit":1500,"period":"30s"}],"no-op":[{"resource":"credential-store","action":"no-op","per":"ip-address","unlimited":false,"limit":30000,"period":"30s"},{"resource":"credential-store","action":"no-op","per":"total","unlimited":false,"limit":30000,"period":"30s"},{"resource":"credential-store","action":"no-op","per":"auth-token","unlimited":false,"limit":3000,"period":"30s"}],"read":[{"resource":"credential-store","action":"read","per":"total","unlimited":false,"limit":30000,"period":"30s"},{"resource":"credential-store","action":"read","per":"ip-address","unlimited":false,"limit":30000,"period":"30s"},{"resource":"credential-store","action":"read","per":"auth-token","unlimited":false,"limit":3000,"period":"30s"}],"update":[{"resource":"credential-store","action":"update","per":"ip-address","unlimited":false,"limit":30000,"period":"30s"},{"resource":"credential-store","action":"update","per":"total","unlimited":false,"limit":30000,"period":"30s"},{"resource":"credential-store","action":"update","per":"auth-token","unlimited":false,"limit":3000,"period":"30s"}]},"group":{"add-members":[{"resource":"group","action":"add-members","per":"ip-address","unlimited":false,"limit":30000,"period":"30s"},{"resource":"group","action":"add-members","per":"auth-token","unlimited":false,"limit":3000,"period":"30s"},{"resource":"group","action":"add-members","per":"total","unlimited":false,"limit":30000,"period":"30s"}],"create":[{"resource":"group","action":"create","per":"total","unlimited":false,"limit":30000,"period":"30s"},{"resource":"group","action":"create","per":"auth-token","unlimited":false,"limit":3000,"period":"30s"},{"resource":"group","action":"create","per":"ip-address","unlimited":false,"limit":30000,"period":"30s"}],"delete":[{"resource":"group","action":"delete","per":"total","unlimited":false,"limit":30000,"period":"30s"},{"resource":"group","action":"delete","per":"ip-address","unlimited":false,"limit":30000,"period":"30s"},{"resource":"group","action":"delete","per":"auth-token","unlimited":false,"limit":3000,"period":"30s"}],"list":[{"resource":"group","action":"list","per":"auth-token","unlimited":false,"limit":150,"period":"30s"},{"resource":"group","action":"list","per":"ip-address","unlimited":false,"limit":1500,"period":"30s"},{"resource":"group","action":"list","per":"total","unlimited":false,"limit":1500,"period":"30s"}],"no-op":[{"resource":"group","action":"no-op","per":"auth-token","unlimited":false,"limit":3000,"period":"30s"},{"resource":"group","action":"no-op","per":"ip-address","unlimited":false,"limit":30000,"period":"30s"},{"resource":"group","action":"no-op","per":"total","unlimited":false,"limit":30000,"period":"30s"}],"read":[{"resource":"group","action":"read","per":"ip-address","unlimited":false,"limit":30000,"period":"30s"},{"resource":"group","action":"read","per":"total","unlimited":false,"limit":30000,"period":"30s"},{"resource":"group","action":"read","per":"auth-token","unlimited":false,"limit":3000,"period":"30s"}],"remove-members":[{"resource":"group","action":"remove-members","per":"total","unlimited":false,"limit":30000,"period":"30s"},{"resource":"group","action":"remove-members","per":"auth-token","unlimited":false,"limit":3000,"period":"30s"},{"resource":"group","action":"remove-members","per":"ip-address","unlimited":false,"limit":30000,"period":"30s"}],"set-members":[{"resource":"group","action":"set-members","per":"total","unlimited":false,"limit":30000,"period":"30s"},{"resource":"group","action":"set-members","per":"ip-address","unlimited":false,"limit":30000,"period":"30s"},{"resource":"group","action":"set-members","per":"auth-token","unlimited":false,"limit":3000,"period":"30s"}],"update":[{"resource":"group","action":"update","per":"auth-token","unlimited":false,"limit":3000,"period":"30s"},{"resource":"group","action":"update","per":"ip-address","unlimited":false,"limit":30000,"period":"30s"},{"resource":"group","action":"update","per":"total","unlimited":false,"limit":30000,"period":"30s"}]},"host":{"create":[{"resource":"host","action":"create","per":"auth-token","unlimited":false,"limit":3000,"period":"30s"},{"resource":"host","action":"create","per":"total","unlimited":false,"limit":30000,"period":"30s"},{"resource":"host","action":"create","per":"ip-address","unlimited":false,"limit":30000,"period":"30s"}],"delete":[{"resource":"host","action":"delete","per":"auth-token","unlimited":false,"limit":3000,"period":"30s"},{"resource":"host","action":"delete","per":"ip-address","unlimited":false,"limit":30000,"period":"30s"},{"resource":"host","action":"delete","per":"total","unlimited":false,"limit":30000,"period":"30s"}],"list":[{"resource":"host","action":"list","per":"total","unlimited":false,"limit":1500,"period":"30s"},{"resource":"host","action":"list","per":"ip-address","unlimited":false,"limit":1500,"period":"30s"},{"resource":"host","action":"list","per":"auth-token","unlimited":false,"limit":150,"period":"30s"}],"no-op":[{"resource":"host","action":"no-op","per":"ip-address","unlimited":false,"limit":30000,"period":"30s"},{"resource":"host","action":"no-op","per":"auth-token","unlimited":false,"limit":3000,"period":"30s"},{"resource":"host","action":"no-op","per":"total","unlimited":false,"limit":30000,"period":"30s"}],"read":[{"resource":"host","action":"read","per":"ip-address","unlimited":false,"limit":30000,"period":"30s"},{"resource":"host","action":"read","per":"total","unlimited":false,"limit":30000,"period":"30s"},{"resource":"host","action":"read","per":"auth-token","unlimited":false,"limit":3000,"period":"30s"}],"update":[{"resource":"host","action":"update","per":"total","unlimited":false,"limit":30000,"period":"30s"},{"resource":"host","action":"update","per":"auth-token","unlimited":false,"limit":3000,"period":"30s"},{"resource":"host","action":"update","per":"ip-address","unlimited":false,"limit":30000,"period":"30s"}]},"host-catalog":{"create":[{"resource":"host-catalog","action":"create","per":"total","unlimited":false,"limit":30000,"period":"30s"},{"resource":"host-catalog","action":"create","per":"ip-address","unlimited":false,"limit":30000,"period":"30s"},{"resource":"host-catalog","action":"create","per":"auth-token","unlimited":false,"limit":3000,"period":"30s"}],"delete":[{"resource":"host-catalog","action":"delete","per":"auth-token","unlimited":false,"limit":3000,"period":"30s"},{"resource":"host-catalog","action":"delete","per":"ip-address","unlimited":false,"limit":30000,"period":"30s"},{"resource":"host-catalog","action":"delete","per":"total","unlimited":false,"limit":30000,"period":"30s"}],"list":[{"resource":"host-catalog","action":"list","per":"total","unlimited":false,"limit":1500,"period":"30s"},{"resource":"host-catalog","action":"list","per":"auth-token","unlimited":false,"limit":150,"period":"30s"},{"resource":"host-catalog","action":"list","per":"ip-address","unlimited":false,"limit":1500,"period":"30s"}],"no-op":[{"resource":"host-catalog","action":"no-op","per":"total","unlimited":false,"limit":30000,"period":"30s"},{"resource":"host-catalog","action":"no-op","per":"ip-address","unlimited":false,"limit":30000,"period":"30s"},{"resource":"host-catalog","action":"no-op","per":"auth-token","unlimited":false,"limit":3000,"period":"30s"}],"read":[{"resource":"host-catalog","action":"read","per":"total","unlimited":false,"limit":30000,"period":"30s"},{"resource":"host-catalog","action":"read","per":"auth-token","unlimited":false,"limit":3000,"period":"30s"},{"resource":"host-catalog","action":"read","per":"ip-address","unlimited":false,"limit":30000,"period":"30s"}],"update":[{"resource":"host-catalog","action":"update","per":"total","unlimited":false,"limit":30000,"period":"30s"},{"resource":"host-catalog","action":"update","per":"auth-token","unlimited":false,"limit":3000,"period":"30s"},{"resource":"host-catalog","action":"update","per":"ip-address","unlimited":false,"limit":30000,"period":"30s"}]},"host-set":{"add-hosts":[{"resource":"host-set","action":"add-hosts","per":"auth-token","unlimited":false,"limit":3000,"period":"30s"},{"resource":"host-set","action":"add-hosts","per":"total","unlimited":false,"limit":30000,"period":"30s"},{"resource":"host-set","action":"add-hosts","per":"ip-address","unlimited":false,"limit":30000,"period":"30s"}],"create":[{"resource":"host-set","action":"create","per":"total","unlimited":false,"limit":30000,"period":"30s"},{"resource":"host-set","action":"create","per":"auth-token","unlimited":false,"limit":3000,"period":"30s"},{"resource":"host-set","action":"create","per":"ip-address","unlimited":false,"limit":30000,"period":"30s"}],"delete":[{"resource":"host-set","action":"delete","per":"ip-address","unlimited":false,"limit":30000,"period":"30s"},{"resource":"host-set","action":"delete","per":"auth-token","unlimited":false,"limit":3000,"period":"30s"},{"resource":"host-set","action":"delete","per":"total","unlimited":false,"limit":30000,"period":"30s"}],"list":[{"resource":"host-set","action":"list","per":"auth-token","unlimited":false,"limit":150,"period":"30s"},{"resource":"host-set","action":"list","per":"ip-address","unlimited":false,"limit":1500,"period":"30s"},{"resource":"host-set","action":"list","per":"total","unlimited":false,"limit":1500,"period":"30s"}],"no-op":[{"resource":"host-set","action":"no-op","per":"total","unlimited":false,"limit":30000,"period":"30s"},{"resource":"host-set","action":"no-op","per":"auth-token","unlimited":false,"limit":3000,"period":"30s"},{"resource":"host-set","action":"no-op","per":"ip-address","unlimited":false,"limit":30000,"period":"30s"}],"read":[{"resource":"host-set","action":"read","per":"ip-address","unlimited":false,"limit":30000,"period":"30s"},{"resource":"host-set","action":"read","per":"auth-token","unlimited":false,"limit":3000,"period":"30s"},{"resource":"host-set","action":"read","per":"total","unlimited":false,"limit":30000,"period":"30s"}],"remove-hosts":[{"resource":"host-set","action":"remove-hosts","per":"total","unlimited":false,"limit":30000,"period":"30s"},{"resource":"host-set","action":"remove-hosts","per":"auth-token","unlimited":false,"limit":3000,"period":"30s"},{"resource":"host-set","action":"remove-hosts","per":"ip-address","unlimited":false,"limit":30000,"period":"30s"}],"set-hosts":[{"resource":"host-set","action":"set-hosts","per":"ip-address","unlimited":false,"limit":30000,"period":"30s"},{"resource":"host-set","action":"set-hosts","per":"total","unlimited":false,"limit":30000,"period":"30s"},{"resource":"host-set","action":"set-hosts","per":"auth-token","unlimited":false,"limit":3000,"period":"30s"}],"update":[{"resource":"host-set","action":"update","per":"auth-token","unlimited":false,"limit":3000,"period":"30s"},{"resource":"host-set","action":"update","per":"total","unlimited":false,"limit":30000,"period":"30s"},{"resource":"host-set","action":"update","per":"ip-address","unlimited":false,"limit":30000,"period":"30s"}]},"managed-group":{"create":[{"resource":"managed-group","action":"create","per":"ip-address","unlimited":false,"limit":30000,"period":"30s"},{"resource":"managed-group","action":"create","per":"total","unlimited":false,"limit":30000,"period":"30s"},{"resource":"managed-group","action":"create","per":"auth-token","unlimited":false,"limit":3000,"period":"30s"}],"delete":[{"resource":"managed-group","action":"delete","per":"ip-address","unlimited":false,"limit":30000,"period":"30s"},{"resource":"managed-group","action":"delete","per":"auth-token","unlimited":false,"limit":3000,"period":"30s"},{"resource":"managed-group","action":"delete","per":"total","unlimited":false,"limit":30000,"period":"30s"}],"list":[{"resource":"managed-group","action":"list","per":"auth-token","unlimited":false,"limit":150,"period":"30s"},{"resource":"managed-group","action":"list","per":"ip-address","unlimited":false,"limit":1500,"period":"30s"},{"resource":"managed-group","action":"list","per":"total","unlimited":false,"limit":1500,"period":"30s"}],"no-op":[{"resource":"managed-group","action":"no-op","per":"auth-token","unlimited":false,"limit":3000,"period":"30s"},{"resource":"managed-group","action":"no-op","per":"ip-address","unlimited":false,"limit":30000,"period":"30s"},{"resource":"managed-group","action":"no-op","per":"total","unlimited":false,"limit":30000,"period":"30s"}],"read":[{"resource":"managed-group","action":"read","per":"total","unlimited":false,"limit":30000,"period":"30s"},{"resource":"managed-group","action":"read","per":"ip-address","unlimited":false,"limit":30000,"period":"30s"},{"resource":"managed-group","action":"read","per":"auth-token","unlimited":false,"limit":3000,"period":"30s"}],"update":[{"resource":"managed-group","action":"update","per":"total","unlimited":false,"limit":30000,"period":"30s"},{"resource":"managed-group","action":"update","per":"ip-address","unlimited":false,"limit":30000,"period":"30s"},{"resource":"managed-group","action":"update","per":"auth-token","unlimited":false,"limit":3000,"period":"30s"}]},"policy":{"create":[{"resource":"policy","action":"create","per":"auth-token","unlimited":false,"limit":3000,"period":"30s"},{"resource":"policy","action":"create","per":"total","unlimited":false,"limit":30000,"period":"30s"},{"resource":"policy","action":"create","per":"ip-address","unlimited":false,"limit":30000,"period":"30s"}],"delete":[{"resource":"policy","action":"delete","per":"auth-token","unlimited":false,"limit":3000,"period":"30s"},{"resource":"policy","action":"delete","per":"ip-address","unlimited":false,"limit":30000,"period":"30s"},{"resource":"policy","action":"delete","per":"total","unlimited":false,"limit":30000,"period":"30s"}],"list":[{"resource":"policy","action":"list","per":"auth-token","unlimited":false,"limit":150,"period":"30s"},{"resource":"policy","action":"list","per":"ip-address","unlimited":false,"limit":1500,"period":"30s"},{"resource":"policy","action":"list","per":"total","unlimited":false,"limit":1500,"period":"30s"}],"no-op":[{"resource":"policy","action":"no-op","per":"auth-token","unlimited":false,"limit":3000,"period":"30s"},{"resource":"policy","action":"no-op","per":"total","unlimited":false,"limit":30000,"period":"30s"},{"resource":"policy","action":"no-op","per":"ip-address","unlimited":false,"limit":30000,"period":"30s"}],"read":[{"resource":"policy","action":"read","per":"auth-token","unlimited":false,"limit":3000,"period":"30s"},{"resource":"policy","action":"read","per":"ip-address","unlimited":false,"limit":30000,"period":"30s"},{"resource":"policy","action":"read","per":"total","unlimited":false,"limit":30000,"period":"30s"}],"update":[{"resource":"policy","action":"update","per":"auth-token","unlimited":false,"limit":3000,"period":"30s"},{"resource":"policy","action":"update","per":"total","unlimited":false,"limit":30000,"period":"30s"},{"resource":"policy","action":"update","per":"ip-address","unlimited":false,"limit":30000,"period":"30s"}]},"role":{"add-grant-scopes":[{"resource":"role","action":"add-grant-scopes","per":"auth-token","unlimited":false,"limit":3000,"period":"30s"},{"resource":"role","action":"add-grant-scopes","per":"total","unlimited":false,"limit":30000,"period":"30s"},{"resource":"role","action":"add-grant-scopes","per":"ip-address","unlimited":false,"limit":30000,"period":"30s"}],"add-grants":[{"resource":"role","action":"add-grants","per":"auth-token","unlimited":false,"limit":3000,"period":"30s"},{"resource":"role","action":"add-grants","per":"ip-address","unlimited":false,"limit":30000,"period":"30s"},{"resource":"role","action":"add-grants","per":"total","unlimited":false,"limit":30000,"period":"30s"}],"add-principals":[{"resource":"role","action":"add-principals","per":"auth-token","unlimited":false,"limit":3000,"period":"30s"},{"resource":"role","action":"add-principals","per":"ip-address","unlimited":false,"limit":30000,"period":"30s"},{"resource":"role","action":"add-principals","per":"total","unlimited":false,"limit":30000,"period":"30s"}],"create":[{"resource":"role","action":"create","per":"total","unlimited":false,"limit":30000,"period":"30s"},{"resource":"role","action":"create","per":"ip-address","unlimited":false,"limit":30000,"period":"30s"},{"resource":"role","action":"create","per":"auth-token","unlimited":false,"limit":3000,"period":"30s"}],"delete":[{"resource":"role","action":"delete","per":"total","unlimited":false,"limit":30000,"period":"30s"},{"resource":"role","action":"delete","per":"ip-address","unlimited":false,"limit":30000,"period":"30s"},{"resource":"role","action":"delete","per":"auth-token","unlimited":false,"limit":3000,"period":"30s"}],"list":[{"resource":"role","action":"list","per":"auth-token","unlimited":false,"limit":150,"period":"30s"},{"resource":"role","action":"list","per":"ip-address","unlimited":false,"limit":1500,"period":"30s"},{"resource":"role","action":"list","per":"total","unlimited":false,"limit":1500,"period":"30s"}],"no-op":[{"resource":"role","action":"no-op","per":"auth-token","unlimited":false,"limit":3000,"period":"30s"},{"resource":"role","action":"no-op","per":"ip-address","unlimited":false,"limit":30000,"period":"30s"},{"resource":"role","action":"no-op","per":"total","unlimited":false,"limit":30000,"period":"30s"}],"read":[{"resource":"role","action":"read","per":"auth-token","unlimited":false,"limit":3000,"period":"30s"},{"resource":"role","action":"read","per":"ip-address","unlimited":false,"limit":30000,"period":"30s"},{"resource":"role","action":"read","per":"total","unlimited":false,"limit":30000,"period":"30s"}],"remove-grant-scopes":[{"resource":"role","action":"remove-grant-scopes","per":"ip-address","unlimited":false,"limit":30000,"period":"30s"},{"resource":"role","action":"remove-grant-scopes","per":"auth-token","unlimited":false,"limit":3000,"period":"30s"},{"resource":"role","action":"remove-grant-scopes","per":"total","unlimited":false,"limit":30000,"period":"30s"}],"remove-grants":[{"resource":"role","action":"remove-grants","per":"ip-address","unlimited":false,"limit":30000,"period":"30s"},{"resource":"role","action":"remove-grants","per":"auth-token","unlimited":false,"limit":3000,"period":"30s"},{"resource":"role","action":"remove-grants","per":"total","unlimited":false,"limit":30000,"period":"30s"}],"remove-principals":[{"resource":"role","action":"remove-principals","per":"auth-token","unlimited":false,"limit":3000,"period":"30s"},{"resource":"role","action":"remove-principals","per":"total","unlimited":false,"limit":30000,"period":"30s"},{"resource":"role","action":"remove-principals","per":"ip-address","unlimited":false,"limit":30000,"period":"30s"}],"set-grant-scopes":[{"resource":"role","action":"set-grant-scopes","per":"ip-address","unlimited":false,"limit":30000,"period":"30s"},{"resource":"role","action":"set-grant-scopes","per":"auth-token","unlimited":false,"limit":3000,"period":"30s"},{"resource":"role","action":"set-grant-scopes","per":"total","unlimited":false,"limit":30000,"period":"30s"}],"set-grants":[{"resource":"role","action":"set-grants","per":"total","unlimited":false,"limit":30000,"period":"30s"},{"resource":"role","action":"set-grants","per":"auth-token","unlimited":false,"limit":3000,"period":"30s"},{"resource":"role","action":"set-grants","per":"ip-address","unlimited":false,"limit":30000,"period":"30s"}],"set-principals":[{"resource":"role","action":"set-principals","per":"ip-address","unlimited":false,"limit":30000,"period":"30s"},{"resource":"role","action":"set-principals","per":"total","unlimited":false,"limit":30000,"period":"30s"},{"resource":"role","action":"set-principals","per":"auth-token","unlimited":false,"limit":3000,"period":"30s"}],"update":[{"resource":"role","action":"update","per":"auth-token","unlimited":false,"limit":3000,"period":"30s"},{"resource":"role","action":"update","per":"ip-address","unlimited":false,"limit":30000,"period":"30s"},{"resource":"role","action":"update","per":"total","unlimited":false,"limit":30000,"period":"30s"}]},"scope":{"attach-storage-policy":[{"resource":"scope","action":"attach-storage-policy","per":"total","unlimited":false,"limit":30000,"period":"30s"},{"resource":"scope","action":"attach-storage-policy","per":"ip-address","unlimited":false,"limit":30000,"period":"30s"},{"resource":"scope","action":"attach-storage-policy","per":"auth-token","unlimited":false,"limit":3000,"period":"30s"}],"create":[{"resource":"scope","action":"create","per":"ip-address","unlimited":false,"limit":30000,"period":"30s"},{"resource":"scope","action":"create","per":"auth-token","unlimited":false,"limit":3000,"period":"30s"},{"resource":"scope","action":"create","per":"total","unlimited":false,"limit":30000,"period":"30s"}],"delete":[{"resource":"scope","action":"delete","per":"total","unlimited":false,"limit":30000,"period":"30s"},{"resource":"scope","action":"delete","per":"auth-token","unlimited":false,"limit":3000,"period":"30s"},{"resource":"scope","action":"delete","per":"ip-address","unlimited":false,"limit":30000,"period":"30s"}],"destroy-key-version":[{"resource":"scope","action":"destroy-key-version","per":"auth-token","unlimited":false,"limit":3000,"period":"30s"},{"resource":"scope","action":"destroy-key-version","per":"total","unlimited":false,"limit":30000,"period":"30s"},{"resource":"scope","action":"destroy-key-version","per":"ip-address","unlimited":false,"limit":30000,"period":"30s"}],"detach-storage-policy":[{"resource":"scope","action":"detach-storage-policy","per":"ip-address","unlimited":false,"limit":30000,"period":"30s"},{"resource":"scope","action":"detach-storage-policy","per":"auth-token","unlimited":false,"limit":3000,"period":"30s"},{"resource":"scope","action":"detach-storage-policy","per":"total","unlimited":false,"limit":30000,"period":"30s"}],"list":[{"resource":"scope","action":"list","per":"auth-token","unlimited":false,"limit":150,"period":"30s"},{"resource":"scope","action":"list","per":"total","unlimited":false,"limit":1500,"period":"30s"},{"resource":"scope","action":"list","per":"ip-address","unlimited":false,"limit":1500,"period":"30s"}],"list-key-version-destruction-jobs":[{"resource":"scope","action":"list-key-version-destruction-jobs","per":"ip-address","unlimited":false,"limit":30000,"period":"30s"},{"resource":"scope","action":"list-key-version-destruction-jobs","per":"total","unlimited":false,"limit":30000,"period":"30s"},{"resource":"scope","action":"list-key-version-destruction-jobs","per":"auth-token","unlimited":false,"limit":3000,"period":"30s"}],"list-keys":[{"resource":"scope","action":"list-keys","per":"ip-address","unlimited":false,"limit":30000,"period":"30s"},{"resource":"scope","action":"list-keys","per":"total","unlimited":false,"limit":30000,"period":"30s"},{"resource":"scope","action":"list-keys","per":"auth-token","unlimited":false,"limit":3000,"period":"30s"}],"no-op":[{"resource":"scope","action":"no-op","per":"ip-address","unlimited":false,"limit":30000,"period":"30s"},{"resource":"scope","action":"no-op","per":"auth-token","unlimited":false,"limit":3000,"period":"30s"},{"resource":"scope","action":"no-op","per":"total","unlimited":false,"limit":30000,"period":"30s"}],"read":[{"resource":"scope","action":"read","per":"ip-address","unlimited":false,"limit":30000,"period":"30s"},{"resource":"scope","action":"read","per":"total","unlimited":false,"limit":30000,"period":"30s"},{"resource":"scope","action":"read","per":"auth-token","unlimited":false,"limit":3000,"period":"30s"}],"rotate-keys":[{"resource":"scope","action":"rotate-keys","per":"total","unlimited":false,"limit":30000,"period":"30s"},{"resource":"scope","action":"rotate-keys","per":"ip-address","unlimited":false,"limit":30000,"period":"30s"},{"resource":"scope","action":"rotate-keys","per":"auth-token","unlimited":false,"limit":3000,"period":"30s"}],"update":[{"resource":"scope","action":"update","per":"total","unlimited":false,"limit":30000,"period":"30s"},{"resource":"scope","action":"update","per":"auth-token","unlimited":false,"limit":3000,"period":"30s"},{"resource":"scope","action":"update","per":"ip-address","unlimited":false,"limit":30000,"period":"30s"}]},"session":{"cancel":[{"resource":"session","action":"cancel","per":"total","unlimited":false,"limit":30000,"period":"30s"},{"resource":"session","action":"cancel","per":"auth-token","unlimited":false,"limit":3000,"period":"30s"},{"resource":"session","action":"cancel","per":"ip-address","unlimited":false,"limit":30000,"period":"30s"}],"cancel:self":[{"resource":"session","action":"cancel:self","per":"auth-token","unlimited":false,"limit":3000,"period":"30s"},{"resource":"session","action":"cancel:self","per":"total","unlimited":false,"limit":30000,"period":"30s"},{"resource":"session","action":"cancel:self","per":"ip-address","unlimited":false,"limit":30000,"period":"30s"}],"list":[{"resource":"session","action":"list","per":"ip-address","unlimited":false,"limit":1500,"period":"30s"},{"resource":"session","action":"list","per":"total","unlimited":false,"limit":1500,"period":"30s"},{"resource":"session","action":"list","per":"auth-token","unlimited":false,"limit":150,"period":"30s"}],"no-op":[{"resource":"session","action":"no-op","per":"auth-token","unlimited":false,"limit":3000,"period":"30s"},{"resource":"session","action":"no-op","per":"total","unlimited":false,"limit":30000,"period":"30s"},{"resource":"session","action":"no-op","per":"ip-address","unlimited":false,"limit":30000,"period":"30s"}],"read":[{"resource":"session","action":"read","per":"auth-token","unlimited":false,"limit":3000,"period":"30s"},{"resource":"session","action":"read","per":"total","unlimited":false,"limit":30000,"period":"30s"},{"resource":"session","action":"read","per":"ip-address","unlimited":false,"limit":30000,"period":"30s"}],"read:self":[{"resource":"session","action":"read:self","per":"total","unlimited":false,"limit":30000,"period":"30s"},{"resource":"session","action":"read:self","per":"auth-token","unlimited":false,"limit":3000,"period":"30s"},{"resource":"session","action":"read:self","per":"ip-address","unlimited":false,"limit":30000,"period":"30s"}]},"session-recording":{"delete":[{"resource":"session-recording","action":"delete","per":"total","unlimited":false,"limit":30000,"period":"30s"},{"resource":"session-recording","action":"delete","per":"ip-address","unlimited":false,"limit":30000,"period":"30s"},{"resource":"session-recording","action":"delete","per":"auth-token","unlimited":false,"limit":3000,"period":"30s"}],"download":[{"resource":"session-recording","action":"download","per":"auth-token","unlimited":false,"limit":3000,"period":"30s"},{"resource":"session-recording","action":"download","per":"ip-address","unlimited":false,"limit":30000,"period":"30s"},{"resource":"session-recording","action":"download","per":"total","unlimited":false,"limit":30000,"period":"30s"}],"list":[{"resource":"session-recording","action":"list","per":"auth-token","unlimited":false,"limit":150,"period":"30s"},{"resource":"session-recording","action":"list","per":"ip-address","unlimited":false,"limit":1500,"period":"30s"},{"resource":"session-recording","action":"list","per":"total","unlimited":false,"limit":1500,"period":"30s"}],"no-op":[{"resource":"session-recording","action":"no-op","per":"auth-token","unlimited":false,"limit":3000,"period":"30s"},{"resource":"session-recording","action":"no-op","per":"ip-address","unlimited":false,"limit":30000,"period":"30s"},{"resource":"session-recording","action":"no-op","per":"total","unlimited":false,"limit":30000,"period":"30s"}],"read":[{"resource":"session-recording","action":"read","per":"auth-token","unlimited":false,"limit":3000,"period":"30s"},{"resource":"session-recording","action":"read","per":"total","unlimited":false,"limit":30000,"period":"30s"},{"resource":"session-recording","action":"read","per":"ip-address","unlimited":false,"limit":30000,"period":"30s"}],"reapply-storage-policy":[{"resource":"session-recording","action":"reapply-storage-policy","per":"ip-address","unlimited":false,"limit":30000,"period":"30s"},{"resource":"session-recording","action":"reapply-storage-policy","per":"auth-token","unlimited":false,"limit":3000,"period":"30s"},{"resource":"session-recording","action":"reapply-storage-policy","per":"total","unlimited":false,"limit":30000,"period":"30s"}]},"storage-bucket":{"create":[{"resource":"storage-bucket","action":"create","per":"total","unlimited":false,"limit":30000,"period":"30s"},{"resource":"storage-bucket","action":"create","per":"ip-address","unlimited":false,"limit":30000,"period":"30s"},{"resource":"storage-bucket","action":"create","per":"auth-token","unlimited":false,"limit":3000,"period":"30s"}],"delete":[{"resource":"storage-bucket","action":"delete","per":"total","unlimited":false,"limit":30000,"period":"30s"},{"resource":"storage-bucket","action":"delete","per":"ip-address","unlimited":false,"limit":30000,"period":"30s"},{"resource":"storage-bucket","action":"delete","per":"auth-token","unlimited":false,"limit":3000,"period":"30s"}],"list":[{"resource":"storage-bucket","action":"list","per":"total","unlimited":false,"limit":1500,"period":"30s"},{"resource":"storage-bucket","action":"list","per":"auth-token","unlimited":false,"limit":150,"period":"30s"},{"resource":"storage-bucket","action":"list","per":"ip-address","unlimited":false,"limit":1500,"period":"30s"}],"no-op":[{"resource":"storage-bucket","action":"no-op","per":"auth-token","unlimited":false,"limit":3000,"period":"30s"},{"resource":"storage-bucket","action":"no-op","per":"ip-address","unlimited":false,"limit":30000,"period":"30s"},{"resource":"storage-bucket","action":"no-op","per":"total","unlimited":false,"limit":30000,"period":"30s"}],"read":[{"resource":"storage-bucket","action":"read","per":"total","unlimited":false,"limit":30000,"period":"30s"},{"resource":"storage-bucket","action":"read","per":"ip-address","unlimited":false,"limit":30000,"period":"30s"},{"resource":"storage-bucket","action":"read","per":"auth-token","unlimited":false,"limit":3000,"period":"30s"}],"update":[{"resource":"storage-bucket","action":"update","per":"ip-address","unlimited":false,"limit":30000,"period":"30s"},{"resource":"storage-bucket","action":"update","per":"total","unlimited":false,"limit":30000,"period":"30s"},{"resource":"storage-bucket","action":"update","per":"auth-token","unlimited":false,"limit":3000,"period":"30s"}]},"target":{"add-credential-sources":[{"resource":"target","action":"add-credential-sources","per":"auth-token","unlimited":false,"limit":3000,"period":"30s"},{"resource":"target","action":"add-credential-sources","per":"total","unlimited":false,"limit":30000,"period":"30s"},{"resource":"target","action":"add-credential-sources","per":"ip-address","unlimited":false,"limit":30000,"period":"30s"}],"add-host-sources":[{"resource":"target","action":"add-host-sources","per":"auth-token","unlimited":false,"limit":3000,"period":"30s"},{"resource":"target","action":"add-host-sources","per":"ip-address","unlimited":false,"limit":30000,"period":"30s"},{"resource":"target","action":"add-host-sources","per":"total","unlimited":false,"limit":30000,"period":"30s"}],"authorize-session":[{"resource":"target","action":"authorize-session","per":"auth-token","unlimited":false,"limit":3000,"period":"30s"},{"resource":"target","action":"authorize-session","per":"ip-address","unlimited":false,"limit":30000,"period":"30s"},{"resource":"target","action":"authorize-session","per":"total","unlimited":false,"limit":30000,"period":"30s"}],"create":[{"resource":"target","action":"create","per":"auth-token","unlimited":false,"limit":3000,"period":"30s"},{"resource":"target","action":"create","per":"total","unlimited":false,"limit":30000,"period":"30s"},{"resource":"target","action":"create","per":"ip-address","unlimited":false,"limit":30000,"period":"30s"}],"delete":[{"resource":"target","action":"delete","per":"total","unlimited":false,"limit":30000,"period":"30s"},{"resource":"target","action":"delete","per":"ip-address","unlimited":false,"limit":30000,"period":"30s"},{"resource":"target","action":"delete","per":"auth-token","unlimited":false,"limit":3000,"period":"30s"}],"list":[{"resource":"target","action":"list","per":"auth-token","unlimited":false,"limit":150,"period":"30s"},{"resource":"target","action":"list","per":"total","unlimited":false,"limit":1500,"period":"30s"},{"resource":"target","action":"list","per":"ip-address","unlimited":false,"limit":1500,"period":"30s"}],"no-op":[{"resource":"target","action":"no-op","per":"auth-token","unlimited":false,"limit":3000,"period":"30s"},{"resource":"target","action":"no-op","per":"ip-address","unlimited":false,"limit":30000,"period":"30s"},{"resource":"target","action":"no-op","per":"total","unlimited":false,"limit":30000,"period":"30s"}],"read":[{"resource":"target","action":"read","per":"auth-token","unlimited":false,"limit":3000,"period":"30s"},{"resource":"target","action":"read","per":"ip-address","unlimited":false,"limit":30000,"period":"30s"},{"resource":"target","action":"read","per":"total","unlimited":false,"limit":30000,"period":"30s"}],"remove-credential-sources":[{"resource":"target","action":"remove-credential-sources","per":"auth-token","unlimited":false,"limit":3000,"period":"30s"},{"resource":"target","action":"remove-credential-sources","per":"total","unlimited":false,"limit":30000,"period":"30s"},{"resource":"target","action":"remove-credential-sources","per":"ip-address","unlimited":false,"limit":30000,"period":"30s"}],"remove-host-sources":[{"resource":"target","action":"remove-host-sources","per":"total","unlimited":false,"limit":30000,"period":"30s"},{"resource":"target","action":"remove-host-sources","per":"ip-address","unlimited":false,"limit":30000,"period":"30s"},{"resource":"target","action":"remove-host-sources","per":"auth-token","unlimited":false,"limit":3000,"period":"30s"}],"set-credential-sources":[{"resource":"target","action":"set-credential-sources","per":"ip-address","unlimited":false,"limit":30000,"period":"30s"},{"resource":"target","action":"set-credential-sources","per":"total","unlimited":false,"limit":30000,"period":"30s"},{"resource":"target","action":"set-credential-sources","per":"auth-token","unlimited":false,"limit":3000,"period":"30s"}],"set-host-sources":[{"resource":"target","action":"set-host-sources","per":"auth-token","unlimited":false,"limit":3000,"period":"30s"},{"resource":"target","action":"set-host-sources","per":"ip-address","unlimited":false,"limit":30000,"period":"30s"},{"resource":"target","action":"set-host-sources","per":"total","unlimited":false,"limit":30000,"period":"30s"}],"update":[{"resource":"target","action":"update","per":"auth-token","unlimited":false,"limit":3000,"period":"30s"},{"resource":"target","action":"update","per":"ip-address","unlimited":false,"limit":30000,"period":"30s"},{"resource":"target","action":"update","per":"total","unlimited":false,"limit":30000,"period":"30s"}]},"user":{"add-accounts":[{"resource":"user","action":"add-accounts","per":"ip-address","unlimited":false,"limit":30000,"period":"30s"},{"resource":"user","action":"add-accounts","per":"auth-token","unlimited":false,"limit":3000,"period":"30s"},{"resource":"user","action":"add-accounts","per":"total","unlimited":false,"limit":30000,"period":"30s"}],"create":[{"resource":"user","action":"create","per":"auth-token","unlimited":false,"limit":3000,"period":"30s"},{"resource":"user","action":"create","per":"total","unlimited":false,"limit":30000,"period":"30s"},{"resource":"user","action":"create","per":"ip-address","unlimited":false,"limit":30000,"period":"30s"}],"delete":[{"resource":"user","action":"delete","per":"auth-token","unlimited":false,"limit":3000,"period":"30s"},{"resource":"user","action":"delete","per":"total","unlimited":false,"limit":30000,"period":"30s"},{"resource":"user","action":"delete","per":"ip-address","unlimited":false,"limit":30000,"period":"30s"}],"list":[{"resource":"user","action":"list","per":"total","unlimited":false,"limit":1500,"period":"30s"},{"resource":"user","action":"list","per":"auth-token","unlimited":false,"limit":150,"period":"30s"},{"resource":"user","action":"list","per":"ip-address","unlimited":false,"limit":1500,"period":"30s"}],"list-resolvable-aliases":[{"resource":"user","action":"list-resolvable-aliases","per":"auth-token","unlimited":false,"limit":3000,"period":"30s"},{"resource":"user","action":"list-resolvable-aliases","per":"ip-address","unlimited":false,"limit":30000,"period":"30s"},{"resource":"user","action":"list-resolvable-aliases","per":"total","unlimited":false,"limit":30000,"period":"30s"}],"no-op":[{"resource":"user","action":"no-op","per":"ip-address","unlimited":false,"limit":30000,"period":"30s"},{"resource":"user","action":"no-op","per":"total","unlimited":false,"limit":30000,"period":"30s"},{"resource":"user","action":"no-op","per":"auth-token","unlimited":false,"limit":3000,"period":"30s"}],"read":[{"resource":"user","action":"read","per":"ip-address","unlimited":false,"limit":30000,"period":"30s"},{"resource":"user","action":"read","per":"total","unlimited":false,"limit":30000,"period":"30s"},{"resource":"user","action":"read","per":"auth-token","unlimited":false,"limit":3000,"period":"30s"}],"remove-accounts":[{"resource":"user","action":"remove-accounts","per":"auth-token","unlimited":false,"limit":3000,"period":"30s"},{"resource":"user","action":"remove-accounts","per":"ip-address","unlimited":false,"limit":30000,"period":"30s"},{"resource":"user","action":"remove-accounts","per":"total","unlimited":false,"limit":30000,"period":"30s"}],"set-accounts":[{"resource":"user","action":"set-accounts","per":"auth-token","unlimited":false,"limit":3000,"period":"30s"},{"resource":"user","action":"set-accounts","per":"ip-address","unlimited":false,"limit":30000,"period":"30s"},{"resource":"user","action":"set-accounts","per":"total","unlimited":false,"limit":30000,"period":"30s"}],"update":[{"resource":"user","action":"update","per":"total","unlimited":false,"limit":30000,"period":"30s"},{"resource":"user","action":"update","per":"ip-address","unlimited":false,"limit":30000,"period":"30s"},{"resource":"user","action":"update","per":"auth-token","unlimited":false,"limit":3000,"period":"30s"}]},"worker":{"add-worker-tags":[{"resource":"worker","action":"add-worker-tags","per":"total","unlimited":false,"limit":30000,"period":"30s"},{"resource":"worker","action":"add-worker-tags","per":"ip-address","unlimited":false,"limit":30000,"period":"30s"},{"resource":"worker","action":"add-worker-tags","per":"auth-token","unlimited":false,"limit":3000,"period":"30s"}],"create:controller-led":[{"resource":"worker","action":"create:controller-led","per":"auth-token","unlimited":false,"limit":3000,"period":"30s"},{"resource":"worker","action":"create:controller-led","per":"total","unlimited":false,"limit":30000,"period":"30s"},{"resource":"worker","action":"create:controller-led","per":"ip-address","unlimited":false,"limit":30000,"period":"30s"}],"create:worker-led":[{"resource":"worker","action":"create:worker-led","per":"ip-address","unlimited":false,"limit":30000,"period":"30s"},{"resource":"worker","action":"create:worker-led","per":"auth-token","unlimited":false,"limit":3000,"period":"30s"},{"resource":"worker","action":"create:worker-led","per":"total","unlimited":false,"limit":30000,"period":"30s"}],"delete":[{"resource":"worker","action":"delete","per":"total","unlimited":false,"limit":30000,"period":"30s"},{"resource":"worker","action":"delete","per":"ip-address","unlimited":false,"limit":30000,"period":"30s"},{"resource":"worker","action":"delete","per":"auth-token","unlimited":false,"limit":3000,"period":"30s"}],"list":[{"resource":"worker","action":"list","per":"ip-address","unlimited":false,"limit":1500,"period":"30s"},{"resource":"worker","action":"list","per":"auth-token","unlimited":false,"limit":150,"period":"30s"},{"resource":"worker","action":"list","per":"total","unlimited":false,"limit":1500,"period":"30s"}],"no-op":[{"resource":"worker","action":"no-op","per":"ip-address","unlimited":false,"limit":30000,"period":"30s"},{"resource":"worker","action":"no-op","per":"auth-token","unlimited":false,"limit":3000,"period":"30s"},{"resource":"worker","action":"no-op","per":"total","unlimited":false,"limit":30000,"period":"30s"}],"read":[{"resource":"worker","action":"read","per":"auth-token","unlimited":false,"limit":3000,"period":"30s"},{"resource":"worker","action":"read","per":"total","unlimited":false,"limit":30000,"period":"30s"},{"resource":"worker","action":"read","per":"ip-address","unlimited":false,"limit":30000,"period":"30s"}],"read-certificate-authority":[{"resource":"worker","action":"read-certificate-authority","per":"ip-address","unlimited":false,"limit":30000,"period":"30s"},{"resource":"worker","action":"read-certificate-authority","per":"total","unlimited":false,"limit":30000,"period":"30s"},{"resource":"worker","action":"read-certificate-authority","per":"auth-token","unlimited":false,"limit":3000,"period":"30s"}],"reinitialize-certificate-authority":[{"resource":"worker","action":"reinitialize-certificate-authority","per":"total","unlimited":false,"limit":30000,"period":"30s"},{"resource":"worker","action":"reinitialize-certificate-authority","per":"ip-address","unlimited":false,"limit":30000,"period":"30s"},{"resource":"worker","action":"reinitialize-certificate-authority","per":"auth-token","unlimited":false,"limit":3000,"period":"30s"}],"remove-worker-tags":[{"resource":"worker","action":"remove-worker-tags","per":"ip-address","unlimited":false,"limit":30000,"period":"30s"},{"resource":"worker","action":"remove-worker-tags","per":"auth-token","unlimited":false,"limit":3000,"period":"30s"},{"resource":"worker","action":"remove-worker-tags","per":"total","unlimited":false,"limit":30000,"period":"30s"}],"set-worker-tags":[{"resource":"worker","action":"set-worker-tags","per":"ip-address","unlimited":false,"limit":30000,"period":"30s"},{"resource":"worker","action":"set-worker-tags","per":"auth-token","unlimited":false,"limit":3000,"period":"30s"},{"resource":"worker","action":"set-worker-tags","per":"total","unlimited":false,"limit":30000,"period":"30s"}],"update":[{"resource":"worker","action":"update","per":"ip-address","unlimited":false,"limit":30000,"period":"30s"},{"resource":"worker","action":"update","per":"auth-token","unlimited":false,"limit":3000,"period":"30s"},{"resource":"worker","action":"update","per":"total","unlimited":false,"limit":30000,"period":"30s"}]}},"max_size":338169,"msg":"controller api rate limiter"}},"datacontentype":"application/cloudevents","time":"2024-08-30T17:50:08.963058299Z"}
controller-1  | {"id":"I1AZTZv2iN","source":"https://hashicorp.com/boundary/boundary/controller","specversion":"1.0","type":"system","data":{"version":"v0.1","op":"scheduler.(Scheduler).start","data":{"msg":"scheduling loop running","run interval":"1m0s","run limit":-1,"server id":"docker-controller"}},"datacontentype":"application/cloudevents","time":"2024-08-30T17:50:08.963128924Z"}
controller-1  | {"id":"sT00cbJ9sR","source":"https://hashicorp.com/boundary/boundary/controller","specversion":"1.0","type":"system","data":{"version":"v0.1","op":"github.com/hashicorp/boundary/internal/event.(*HclogLoggerAdapter).writeEvent","data":{"@original-log-level":"none","@original-log-name":"aws","msg":"configuring client automatic mTLS"}},"datacontentype":"application/cloudevents","time":"2024-08-30T17:50:08.963643258Z"}
controller-1  | {"id":"y1BcJweiGF","source":"https://hashicorp.com/boundary/boundary/controller","specversion":"1.0","type":"system","data":{"version":"v0.1","op":"github.com/hashicorp/boundary/internal/event.(*HclogLoggerAdapter).writeEvent","data":{"@original-log-level":"none","@original-log-name":"aws","args":["/tmp/2078027245/boundary-plugin-aws-ViOeF"],"msg":"starting plugin","path":"/tmp/2078027245/boundary-plugin-aws-ViOeF"}},"datacontentype":"application/cloudevents","time":"2024-08-30T17:50:08.963722133Z"}
controller-1  | {"id":"BOYen6BGVZ","source":"https://hashicorp.com/boundary/boundary/controller","specversion":"1.0","type":"system","data":{"version":"v0.1","op":"github.com/hashicorp/boundary/internal/event.(*HclogLoggerAdapter).writeEvent","data":{"@original-log-level":"none","@original-log-name":"aws","msg":"plugin started","path":"/tmp/2078027245/boundary-plugin-aws-ViOeF","pid":26}},"datacontentype":"application/cloudevents","time":"2024-08-30T17:50:08.963763008Z"}

...
... More output ...
...
These events were emitted as part of the provisioning process when the deploy
script was executed.
An event sink is set up in the configuration file for a controller or worker
server. Below are the contents of the events stanza in the
compose/controller.hcl configuration file:
events {
  audit_enabled        = true
  observations_enabled = true
  sysevents_enabled    = true
  telemetry_enabled    = true

  sink "stderr" {
    name        = "all-events"
    description = "All events sent to stderr"
    event_types = ["*"]
    format      = "cloudevents-json"
  }

  sink {
    name        = "controller-audit-sink"
    description = "Audit sent to a file"
    event_types = ["audit"]
    format      = "cloudevents-json"

    file {
      path      = "/logs"
      file_name = "controller.log"
    }

    audit_config {
      audit_filter_overrides {
        secret    = "encrypt"
        sensitive = "hmac-sha256"
      }
    }
  }
}
The types of events that should be emitted by Boundary are declared at the top of the events stanza. In this example audit, observation, sysevents, and telemetry are all enabled.
audit_enabled = true
observation_enabled = true
sysevents_enabled = true
telemetry_enabled = true
audit_enabled: Audit events can specify what data is included and different options for redacting and encrypting that data.observation_enabled: Specifies if observation events should be emitted.sysevents_enabled: Specifies if system events should be emitted.telemetry_enabled: Specifies if telemetry events should be emitted. To receive telemetry events, you must also setobservations_enabledtotrue.
The sink stanza is used to declare a location for emitted events to be sent.
Two types of sinks are available:
stderr: The stderr sink configures Boundary to send events to a stderr.file: The file sink configures Boundary to send events to a file.
The sink stanza can be repeated to make Boundary send events to multiple sinks, but each file sink must have a unique path + file_name.
Default events
When no event stanza is specified, the following default is used:
events {
  audit_enabled = false
  observations_enabled = true
  sysevents_enabled = true
  telemetry_enabled = false

  sink "stderr" {
    name = "default"
    event_types = ["*"]
    format = "cloudevents-json"
  }
}
While this configuration is the default, if other sinks are configured it must
be declared explicitly to send events to stderr.
If logs should be printed to stderr on the controller or workers, the
following configuration must be present:
events {
  audit_enabled = false
  observation_enabled = true
  sysevents_enabled = true
  telemetry_enabled = true

  sink "stderr" {
    name = "all-events"
    description = "All events sent to stderr"
    event_types = ["*"]
    format = "hclog-text"
  }
}
File sinks
The second sink in the events stanza declares a file sink:
sink {
  name        = "controller-audit-sink"
  description = "Audit sent to a file"
  event_types = ["audit"]
  format      = "cloudevents-json"

  file {
    path      = "/logs"
    file_name = "controller.log"
  }

  audit_config {
    audit_filter_overrides {
      secret    = "encrypt"
      sensitive = "hmac-sha256"
    }
  }
}
Each sink declares the type of events that should be written to it. Here all
"audit" events will be written in the cloudevents-json format.
In the file block the path and file_name attributes declare where this
file should be stored on the local filesystem. Note that this file will be
written to /logs/controller.log within the controller container. The lab
environment for this tutorial defined in the docker-compose.yml file sets up the
learn-boundary-event-logging/auditlogs/ path as a shared directory for the
controller and worker docker containers, available on the hosts at /logs.
This can be verified by printing the contents of the log file on the
controller.
$ docker compose exec controller sh -c "cat /logs/controller.log"
rized_downstream_workers":{}}}},"datacontentype":"application/cloudevents","time":"2024-08-30T17:52:34.173480297Z","serialized":"eyJpZCI6ImlEVlBXc0NXQnUiLCJzb3VyY2UiOiJodHRwczovL2hhc2hpY29ycC5jb20vYm91bmRhcnkvYm91bmRhcnkvY29udHJvbGxlciIsInNwZWN2ZXJzaW9uIjoiMS4wIiwidHlwZSI6ImF1ZGl0IiwiZGF0YSI6eyJpZCI6ImVfbWhsQWpLckpJSyIsInZlcnNpb24iOiJ2MC4xIiwidHlwZSI6IkFQSVJlcXVlc3QiLCJ0aW1lc3RhbXAiOiIyMDI0LTA4LTMwVDE3OjUyOjIzLjQzNjc1NDVaIiwicmVxdWVzdF9pbmZvIjp7ImlkIjoiZ3RyYWNlaWRfcTVpVjZNUHhKWHg2SHdubzNneWMiLCJtZXRob2QiOiIvY29udHJvbGxlci5zZXJ2ZXJzLnNlcnZpY2VzLnYxLlNlcnZlckNvb3JkaW5hdGlvblNlcnZpY2UvU3RhdHVzIn0sInJlcXVlc3QiOnsiZGV0YWlscyI6eyJ3b3JrZXJfc3RhdHVzIjp7Im5hbWUiOiJ3b3JrZXIiLCJkZXNjcmlwdGlvbiI6IkEgd29ya2VyIGZvciBhIGRvY2tlciBkZW1vIiwiYWRkcmVzcyI6ImxvY2FsaG9zdDo5MjAyIiwia2V5X2lkIjoicGFzc3dvcmQtY3JpbmdpbmctaGF6aWx5LXNhbmRiYXItZml2ZS1ibGF0YW5jeS1yZWFwcHJvdmUtZmlmdGVlbiIsInJlbGVhc2VfdmVyc2lvbiI6IkJvdW5kYXJ5IHYwLjE3LjEiLCJvcGVyYXRpb25hbF9zdGF0ZSI6ImFjdGl2ZSIsImxvY2FsX3N0b3JhZ2Vfc3RhdGUiOiJub3QgY29uZmlndXJlZCJ9fX0sInJlc3BvbnNlIjp7ImRldGFpbHMiOnsiY2FsY3VsYXRlZF91cHN0cmVhbXMiOlt7InR5cGUiOjEsImFkZHJlc3MiOiJib3VuZGFyeTo5MjAxIn1dLCJ3b3JrZXJfaWQiOiJ3X1hsQ1g4Yk9XczIiLCJhdXRob3JpemVkX3dvcmtlcnMiOnt9LCJhdXRob3JpemVkX2Rvd25zdHJlYW1fd29ya2VycyI6e319fX0sImRhdGFjb250ZW50eXBlIjoiYXBwbGljYXRpb24vY2xvdWRldmVudHMiLCJ0aW1lIjoiMjAyNC0wOC0zMFQxNzo1MjozNC4xNzM0ODAyOTdaIn0K","serialized_hmac":"hmac-sha256:6UpkbMdgTD_Op23Jjmpyu88wE9DadcMKKyUEwWM4Z7g"}
{"id":"2HQb4yRDjA","source":"https://hashicorp.com/boundary/boundary/controller","specversion":"1.0","type":"audit","data":{"id":"e_mhlAjKrJIK","version":"v0.1","type":"APIRequest","timestamp":"2024-08-30T17:52:23.4367545Z","request_info":{"id":"gtraceid_q5iV6MPxJXx6Hwno3gyc","method":"/controller.servers.services.v1.ServerCoordinationService/Status"},"request":{"details":{"worker_status":{"name":"worker","description":"A worker for a docker demo","address":"localhost:9202","key_id":"password-cringing-hazily-sandbar-five-blatancy-reapprove-fifteen","release_version":"Boundary v0.17.1","operational_state":"active","local_storage_state":"not configured"}}},"response":{"details":{"calculated_upstreams":[{"type":1,"address":"boundary:9201"}],"worker_id":"w_XlCX8bOWs2","authorized_workers":{},"authorized_downstream_workers":{}}}},"datacontentype":"application/cloudevents","time":"2024-08-30T17:52:34.174034255Z","serialized":"eyJpZCI6IjJIUWI0eVJEakEiLCJzb3VyY2UiOiJodHRwczovL2hhc2hpY29ycC5jb20vYm91bmRhcnkvYm91bmRhcnkvY29udHJvbGxlciIsInNwZWN2ZXJzaW9uIjoiMS4wIiwidHlwZSI6ImF1ZGl0IiwiZGF0YSI6eyJpZCI6ImVfbWhsQWpLckpJSyIsInZlcnNpb24iOiJ2MC4xIiwidHlwZSI6IkFQSVJlcXVlc3QiLCJ0aW1lc3RhbXAiOiIyMDI0LTA4LTMwVDE3OjUyOjIzLjQzNjc1NDVaIiwicmVxdWVzdF9pbmZvIjp7ImlkIjoiZ3RyYWNlaWRfcTVpVjZNUHhKWHg2SHdubzNneWMiLCJtZXRob2QiOiIvY29udHJvbGxlci5zZXJ2ZXJzLnNlcnZpY2VzLnYxLlNlcnZlckNvb3JkaW5hdGlvblNlcnZpY2UvU3RhdHVzIn0sInJlcXVlc3QiOnsiZGV0YWlscyI6eyJ3b3JrZXJfc3RhdHVzIjp7Im5hbWUiOiJ3b3JrZXIiLCJkZXNjcmlwdGlvbiI6IkEgd29ya2VyIGZvciBhIGRvY2tlciBkZW1vIiwiYWRkcmVzcyI6ImxvY2FsaG9zdDo5MjAyIiwia2V5X2lkIjoicGFzc3dvcmQtY3JpbmdpbmctaGF6aWx5LXNhbmRiYXItZml2ZS1ibGF0YW5jeS1yZWFwcHJvdmUtZmlmdGVlbiIsInJlbGVhc2VfdmVyc2lvbiI6IkJvdW5kYXJ5IHYwLjE3LjEiLCJvcGVyYXRpb25hbF9zdGF0ZSI6ImFjdGl2ZSIsImxvY2FsX3N0b3JhZ2Vfc3RhdGUiOiJub3QgY29uZmlndXJlZCJ9fX0sInJlc3BvbnNlIjp7ImRldGFpbHMiOnsiY2FsY3VsYXRlZF91cHN0cmVhbXMiOlt7InR5cGUiOjEsImFkZHJlc3MiOiJib3VuZGFyeTo5MjAxIn1dLCJ3b3JrZXJfaWQiOiJ3X1hsQ1g4Yk9XczIiLCJhdXRob3JpemVkX3dvcmtlcnMiOnt9LCJhdXRob3JpemVkX2Rvd25zdHJlYW1fd29ya2VycyI6e319fX0sImRhdGFjb250ZW50eXBlIjoiYXBwbGljYXRpb24vY2xvdWRldmVudHMiLCJ0aW1lIjoiMjAyNC0wOC0zMFQxNzo1MjozNC4xNzQwMzQyNTVaIn0K","serialized_hmac":"hmac-sha256:MoYiXYX2xkX7kEJ5HUe57Ve4gzjJacwSLoEHdIILmUM"}
{"id":"twOajSbG3z","source":"https://hashicorp.com/boundary/boundary/controller","specversion":"1.0","type":"audit","data":{"id":"e_ZjJdFLbMbK","version":"v0.1","type":"APIRequest","timestamp":"2024-08-30T17:52:34.174896922Z","request_info":{"id":"gtraceid_b7egiU9kmuQgJZZ7xMPw","method":"GET","path":"/health","client_ip":"172.18.0.7"},"request":{"details":{}},"response":{"status_code":200,"details":{}},"correlation_id":"ce9be208-b92b-75eb-beff-823d869621ce"},"datacontentype":"application/cloudevents","time":"2024-08-30T17:52:34.174903839Z","serialized":"eyJpZCI6InR3T2FqU2JHM3oiLCJzb3VyY2UiOiJodHRwczovL2hhc2hpY29ycC5jb20vYm91bmRhcnkvYm91bmRhcnkvY29udHJvbGxlciIsInNwZWN2ZXJzaW9uIjoiMS4wIiwidHlwZSI6ImF1ZGl0IiwiZGF0YSI6eyJpZCI6ImVfWmpKZEZMYk1iSyIsInZlcnNpb24iOiJ2MC4xIiwidHlwZSI6IkFQSVJlcXVlc3QiLCJ0aW1lc3RhbXAiOiIyMDI0LTA4LTMwVDE3OjUyOjM0LjE3NDg5NjkyMloiLCJyZXF1ZXN0X2luZm8iOnsiaWQiOiJndHJhY2VpZF9iN2VnaVU5a211UWdKWlo3eE1QdyIsIm1ldGhvZCI6IkdFVCIsInBhdGgiOiIvaGVhbHRoIiwiY2xpZW50X2lwIjoiMTcyLjE4LjAuNyJ9LCJyZXF1ZXN0Ijp7ImRldGFpbHMiOnt9fSwicmVzcG9uc2UiOnsic3RhdHVzX2NvZGUiOjIwMCwiZGV0YWlscyI6e319LCJjb3JyZWxhdGlvbl9pZCI6ImNlOWJlMjA4LWI5MmItNzVlYi1iZWZmLTgyM2Q4Njk2MjFjZSJ9LCJkYXRhY29udGVudHlwZSI6ImFwcGxpY2F0aW9uL2Nsb3VkZXZlbnRzIiwidGltZSI6IjIwMjQtMDgtMzBUMTc6NTI6MzQuMTc0OTAzODM5WiJ9Cg","serialized_hmac":"hmac-sha256:oOvXWlsljuIl0f0yNWQkCst8_GbUOOo6zj1FjW77ChM"}
{"id":"TGCBK0aJgi","source":"https://hashicorp.com/boundary/boundary/controller","specversion":"1.0","type":"audit","data":{"id":"e_gw0MDFwWOz","version":"v0.1","type":"APIRequest","timestamp":"2024-08-30T17:52:25.273944918Z","request_info":{"id":"gtraceid_45cs79j4KMjkqQJmcITr","method":"/controller.servers.services.v1.ServerCoordinationService/Status"},"request":{"details":{"worker_status":{"name":"worker","description":"A worker for a docker demo","address":"localhost:9202","key_id":"password-cringing-hazily-sandbar-five-blatancy-reapprove-fifteen","release_version":"Boundary v0.17.1","operational_state":"active","local_storage_state":"not configured"}}},"response":{"details":{"calculated_upstreams":[{"type":1,"address":"boundary:9201"}],"worker_id":"w_XlCX8bOWs2","authorized_workers":{},"authorized_downstream_workers":{}}}},"datacontentype":"application/cloudevents","time":"2024-08-30T17:52:35.553045381Z","serialized":"eyJpZCI6IlRHQ0JLMGFKZ2kiLCJzb3VyY2UiOiJodHRwczovL2hhc2hpY29ycC5jb20vYm91bmRhcnkvYm91bmRhcnkvY29udHJvbGxlciIsInNwZWN2ZXJzaW9uIjoiMS4wIiwidHlwZSI6ImF1ZGl0IiwiZGF0YSI6eyJpZCI6ImVfZ3cwTURGd1dPeiIsInZlcnNpb24iOiJ2MC4xIiwidHlwZSI6IkFQSVJlcXVlc3QiLCJ0aW1lc3RhbXAiOiIyMDI0LTA4LTMwVDE3OjUyOjI1LjI3Mzk0NDkxOFoiLCJyZXF1ZXN0X2luZm8iOnsiaWQiOiJndHJhY2VpZF80NWNzNzlqNEtNamtxUUptY0lUciIsIm1ldGhvZCI6Ii9jb250cm9sbGVyLnNlcnZlcnMuc2VydmljZXMudjEuU2VydmVyQ29vcmRpbmF0aW9uU2VydmljZS9TdGF0dXMifSwicmVxdWVzdCI6eyJkZXRhaWxzIjp7Indvcmtlcl9zdGF0dXMiOnsibmFtZSI6IndvcmtlciIsImRlc2NyaXB0aW9uIjoiQSB3b3JrZXIgZm9yIGEgZG9ja2VyIGRlbW8iLCJhZGRyZXNzIjoibG9jYWxob3N0OjkyMDIiLCJrZXlfaWQiOiJwYXNzd29yZC1jcmluZ2luZy1oYXppbHktc2FuZGJhci1maXZlLWJsYXRhbmN5LXJlYXBwcm92ZS1maWZ0ZWVuIiwicmVsZWFzZV92ZXJzaW9uIjoiQm91bmRhcnkgdjAuMTcuMSIsIm9wZXJhdGlvbmFsX3N0YXRlIjoiYWN0aXZlIiwibG9jYWxfc3RvcmFnZV9zdGF0ZSI6Im5vdCBjb25maWd1cmVkIn19fSwicmVzcG9uc2UiOnsiZGV0YWlscyI6eyJjYWxjdWxhdGVkX3Vwc3RyZWFtcyI6W3sidHlwZSI6MSwiYWRkcmVzcyI6ImJvdW5kYXJ5OjkyMDEifV0sIndvcmtlcl9pZCI6IndfWGxDWDhiT1dzMiIsImF1dGhvcml6ZWRfd29ya2VycyI6e30sImF1dGhvcml6ZWRfZG93bnN0cmVhbV93b3JrZXJzIjp7fX19fSwiZGF0YWNvbnRlbnR5cGUiOiJhcHBsaWNhdGlvbi9jbG91ZGV2ZW50cyIsInRpbWUiOiIyMDI0LTA4LTMwVDE3OjUyOjM1LjU1MzA0NTM4MVoifQo","serialized_hmac":"hmac-sha256:5SRdgj9k2tPhfuJxfosO0cDG-7H5XEIwylt25im0rHI"}
{"id":"HIkNVzimgy","source":"https://hashicorp.com/boundary/boundary/controller","specversion":"1.0","type":"audit","data":{"id":"e_gw0MDFwWOz","version":"v0.1","type":"APIRequest","timestamp":"2024-08-30T17:52:25.273944918Z","request_info":{"id":"gtraceid_45cs79j4KMjkqQJmcITr","method":"/controller.servers.services.v1.ServerCoordinationService/Status"},"request":{"details":{"worker_status":{"name":"worker","description":"A worker for a docker demo","address":"localhost:9202","key_id":"password-cringing-hazily-sandbar-five-blatancy-reapprove-fifteen","release_version":"Boundary v0.17.1","operational_state":"active","local_storage_state":"not configured"}}},"response":{"details":{"calculated_upstreams":[{"type":1,"address":"boundary:9201"}],"worker_id":"w_XlCX8bOWs2","authorized_workers":{},"authorized_downstream_workers":{}}}},"datacontentype":"application/cloudevents","time":"2024-08-30T17:52:35.553697714Z","serialized":"eyJpZCI6IkhJa05WemltZ3kiLCJzb3VyY2UiOiJodHRwczovL2hhc2hpY29ycC5jb20vYm91bmRhcnkvYm91bmRhcnkvY29udHJvbGxlciIsInNwZWN2ZXJzaW9uIjoiMS4wIiwidHlwZSI6ImF1ZGl0IiwiZGF0YSI6eyJpZCI6ImVfZ3cwTURGd1dPeiIsInZlcnNpb24iOiJ2MC4xIiwidHlwZSI6IkFQSVJlcXVlc3QiLCJ0aW1lc3RhbXAiOiIyMDI0LTA4LTMwVDE3OjUyOjI1LjI3Mzk0NDkxOFoiLCJyZXF1ZXN0X2luZm8iOnsiaWQiOiJndHJhY2VpZF80NWNzNzlqNEtNamtxUUptY0lUciIsIm1ldGhvZCI6Ii9jb250cm9sbGVyLnNlcnZlcnMuc2VydmljZXMudjEuU2VydmVyQ29vcmRpbmF0aW9uU2VydmljZS9TdGF0dXMifSwicmVxdWVzdCI6eyJkZXRhaWxzIjp7Indvcmtlcl9zdGF0dXMiOnsibmFtZSI6IndvcmtlciIsImRlc2NyaXB0aW9uIjoiQSB3b3JrZXIgZm9yIGEgZG9ja2VyIGRlbW8iLCJhZGRyZXNzIjoibG9jYWxob3N0OjkyMDIiLCJrZXlfaWQiOiJwYXNzd29yZC1jcmluZ2luZy1oYXppbHktc2FuZGJhci1maXZlLWJsYXRhbmN5LXJlYXBwcm92ZS1maWZ0ZWVuIiwicmVsZWFzZV92ZXJzaW9uIjoiQm91bmRhcnkgdjAuMTcuMSIsIm9wZXJhdGlvbmFsX3N0YXRlIjoiYWN0aXZlIiwibG9jYWxfc3RvcmFnZV9zdGF0ZSI6Im5vdCBjb25maWd1cmVkIn19fSwicmVzcG9uc2UiOnsiZGV0YWlscyI6eyJjYWxjdWxhdGVkX3Vwc3RyZWFtcyI6W3sidHlwZSI6MSwiYWRkcmVzcyI6ImJvdW5kYXJ5OjkyMDEifV0sIndvcmtlcl9pZCI6IndfWGxDWDhiT1dzMiIsImF1dGhvcml6ZWRfd29ya2VycyI6e30sImF1dGhvcml6ZWRfZG93bnN0cmVhbV93b3JrZXJzIjp7fX19fSwiZGF0YWNvbnRlbnR5cGUiOiJhcHBsaWNhdGlvbi9jbG91ZGV2ZW50cyIsInRpbWUiOiIyMDI0LTA4LTMwVDE3OjUyOjM1LjU1MzY5NzcxNFoifQo","serialized_hmac":"hmac-sha256:BK42oOvttDJuYzqaTV7d7jVZ-R3MJCFPtkikRV4rNAM"}
{"id":"LmHUewdbyi","source":"https://hashicorp.com/boundary/boundary/controller","specversion":"1.0","type":"audit","data":{"id":"e_AZutuw1lUH","version":"v0.1","type":"APIRequest","timestamp":"2024-08-30T17:52:27.473736294Z","request_info":{"id":"gtraceid_q2si0yOWLFugJozi1WtA","method":"/controller.servers.services.v1.ServerCoordinationService/Status"},"request":{"details":{"worker_status":{"name":"worker","description":"A worker for a docker demo","address":"localhost:9202","key_id":"password-cringing-hazily-sandbar-five-blatancy-reapprove-fifteen","release_version":"Boundary v0.17.1","operational_state":"active","local_storage_state":"not configured"}}},"response":{"details":{"calculated_upstreams":[{"type":1,"address":"boundary:9201"}],"worker_id":"w_XlCX8bOWs2","authorized_workers":{},"authorized_downstream_workers":{}}}},"datacontentype":"application/cloudevents","time":"2024-08-30T17:52:37.720367215Z","serialized":"eyJpZCI6IkxtSFVld2RieWkiLCJzb3VyY2UiOiJodHRwczovL2hhc2hpY29ycC5jb20vYm91bmRhcnkvYm91bmRhcnkvY29udHJvbGxlciIsInNwZWN2ZXJzaW9uIjoiMS4wIiwidHlwZSI6ImF1ZGl0IiwiZGF0YSI6eyJpZCI6ImVfQVp1dHV3MWxVSCIsInZlcnNpb24iOiJ2MC4xIiwidHlwZSI6IkFQSVJlcXVlc3QiLCJ0aW1lc3RhbXAiOiIyMDI0LTA4LTMwVDE3OjUyOjI3LjQ3MzczNjI5NFoiLCJyZXF1ZXN0X2luZm8iOnsiaWQiOiJndHJhY2VpZF9xMnNpMHlPV0xGdWdKb3ppMVd0QSIsIm1ldGhvZCI6Ii9jb250cm9sbGVyLnNlcnZlcnMuc2VydmljZXMudjEuU2VydmVyQ29vcmRpbmF0aW9uU2VydmljZS9TdGF0dXMifSwicmVxdWVzdCI6eyJkZXRhaWxzIjp7Indvcmtlcl9zdGF0dXMiOnsibmFtZSI6IndvcmtlciIsImRlc2NyaXB0aW9uIjoiQSB3b3JrZXIgZm9yIGEgZG9ja2VyIGRlbW8iLCJhZGRyZXNzIjoibG9jYWxob3N0OjkyMDIiLCJrZXlfaWQiOiJwYXNzd29yZC1jcmluZ2luZy1oYXppbHktc2FuZGJhci1maXZlLWJsYXRhbmN5LXJlYXBwcm92ZS1maWZ0ZWVuIiwicmVsZWFzZV92ZXJzaW9uIjoiQm91bmRhcnkgdjAuMTcuMSIsIm9wZXJhdGlvbmFsX3N0YXRlIjoiYWN0aXZlIiwibG9jYWxfc3RvcmFnZV9zdGF0ZSI6Im5vdCBjb25maWd1cmVkIn19fSwicmVzcG9uc2UiOnsiZGV0YWlscyI6eyJjYWxjdWxhdGVkX3Vwc3RyZWFtcyI6W3sidHlwZSI6MSwiYWRkcmVzcyI6ImJvdW5kYXJ5OjkyMDEifV0sIndvcmtlcl9pZCI6IndfWGxDWDhiT1dzMiIsImF1dGhvcml6ZWRfd29ya2VycyI6e30sImF1dGhvcml6ZWRfZG93bnN0cmVhbV93b3JrZXJzIjp7fX19fSwiZGF0YWNvbnRlbnR5cGUiOiJhcHBsaWNhdGlvbi9jbG91ZGV2ZW50cyIsInRpbWUiOiIyMDI0LTA4LTMwVDE3OjUyOjM3LjcyMDM2NzIxNVoifQo","serialized_hmac":"hmac-sha256:DbDm44MRUyX8qAZdJNKFFSy1XQJ-UsBA5BhKRyUJUZ0"}
{"id":"n63kJtwPF4","source":"https://hashicorp.com/boundary/boundary/controller","specversion":"1.0","type":"audit","data":{"id":"e_AZutuw1lUH","version":"v0.1","type":"APIRequest","timestamp":"2024-08-30T17:52:27.473736294Z","request_info":{"id":"gtraceid_q2si0yOWLFugJozi1WtA","method":"/controller.servers.services.v1.ServerCoordinationService/Status"},"request":{"details":{"worker_status":{"name":"worker","description":"A worker for a docker demo","address":"localhost:9202","key_id":"password-cringing-hazily-sandbar-five-blatancy-reapprove-fifteen","release_version":"Boundary v0.17.1","operational_state":"active","local_storage_state":"not configured"}}},"response":{"details":{"calculated_upstreams":[{"type":1,"address":"boundary:9201"}],"worker_id":"w_XlCX8bOWs2","authorized_workers":{},"authorized_downstream_workers":{}}}},"datacontentype":"application/cloudevents","time":"2024-08-30T17:52:37.720987132Z","serialized":"eyJpZCI6Im42M2tKdHdQRjQiLCJzb3VyY2UiOiJodHRwczovL2hhc2hpY29ycC5jb20vYm91bmRhcnkvYm91bmRhcnkvY29udHJvbGxlciIsInNwZWN2ZXJzaW9uIjoiMS4wIiwidHlwZSI6ImF1ZGl0IiwiZGF0YSI6eyJpZCI6ImVfQVp1dHV3MWxVSCIsInZlcnNpb24iOiJ2MC4xIiwidHlwZSI6IkFQSVJlcXVlc3QiLCJ0aW1lc3RhbXAiOiIyMDI0LTA4LTMwVDE3OjUyOjI3LjQ3MzczNjI5NFoiLCJyZXF1ZXN0X2luZm8iOnsiaWQiOiJndHJhY2VpZF9xMnNpMHlPV0xGdWdKb3ppMVd0QSIsIm1ldGhvZCI6Ii9jb250cm9sbGVyLnNlcnZlcnMuc2VydmljZXMudjEuU2VydmVyQ29vcmRpbmF0aW9uU2VydmljZS9TdGF0dXMifSwicmVxdWVzdCI6eyJkZXRhaWxzIjp7Indvcmtlcl9zdGF0dXMiOnsibmFtZSI6IndvcmtlciIsImRlc2NyaXB0aW9uIjoiQSB3b3JrZXIgZm9yIGEgZG9ja2VyIGRlbW8iLCJhZGRyZXNzIjoibG9jYWxob3N0OjkyMDIiLCJrZXlfaWQiOiJwYXNzd29yZC1jcmluZ2luZy1oYXppbHktc2FuZGJhci1maXZlLWJsYXRhbmN5LXJlYXBwcm92ZS1maWZ0ZWVuIiwicmVsZWFzZV92ZXJzaW9uIjoiQm91bmRhcnkgdjAuMTcuMSIsIm9wZXJhdGlvbmFsX3N0YXRlIjoiYWN0aXZlIiwibG9jYWxfc3RvcmFnZV9zdGF0ZSI6Im5vdCBjb25maWd1cmVkIn19fSwicmVzcG9uc2UiOnsiZGV0YWlscyI6eyJjYWxjdWxhdGVkX3Vwc3RyZWFtcyI6W3sidHlwZSI6MSwiYWRkcmVzcyI6ImJvdW5kYXJ5OjkyMDEifV0sIndvcmtlcl9pZCI6IndfWGxDWDhiT1dzMiIsImF1dGhvcml6ZWRfd29ya2VycyI6e30sImF1dGhvcml6ZWRfZG93bnN0cmVhbV93b3JrZXJzIjp7fX19fSwiZGF0YWNvbnRlbnR5cGUiOiJhcHBsaWNhdGlvbi9jbG91ZGV2ZW50cyIsInRpbWUiOiIyMDI0LTA4LTMwVDE3OjUyOjM3LjcyMDk4NzEzMloifQo","serialized_hmac":"hmac-sha256:KdZZTh38eeoP0seNocVM9jRxhe7g3CA7rWAmfZ1Ycn0"}
{"id":"3xlgAFStLF","source":"https://hashicorp.com/boundary/boundary/controller","specversion":"1.0","type":"audit","data":{"id":"e_pZlwjXN2KT","version":"v0.1","type":"APIRequest","timestamp":"2024-08-30T17:52:29.663134753Z","request_info":{"id":"gtraceid_ahqLSl4q8mu4MLrxzLPh","method":"/controller.servers.services.v1.ServerCoordinationService/Status"},"request":{"details":{"worker_status":{"name":"worker","description":"A worker for a docker demo","address":"localhost:9202","key_id":"password-cringing-hazily-sandbar-five-blatancy-reapprove-fifteen","release_version":"Boundary v0.17.1","operational_state":"active","local_storage_state":"not configured"}}},"response":{"details":{"calculated_upstreams":[{"type":1,"address":"boundary:9201"}],"worker_id":"w_XlCX8bOWs2","authorized_workers":{},"authorized_downstream_workers":{}}}},"datacontentype":"application/cloudevents","time":"2024-08-30T17:52:40.047205675Z","serialized":"eyJpZCI6IjN4bGdBRlN0TEYiLCJzb3VyY2UiOiJodHRwczovL2hhc2hpY29ycC5jb20vYm91bmRhcnkvYm91bmRhcnkvY29udHJvbGxlciIsInNwZWN2ZXJzaW9uIjoiMS4wIiwidHlwZSI6ImF1ZGl0IiwiZGF0YSI6eyJpZCI6ImVfcFpsd2pYTjJLVCIsInZlcnNpb24iOiJ2MC4xIiwidHlwZSI6IkFQSVJlcXVlc3QiLCJ0aW1lc3RhbXAiOiIyMDI0LTA4LTMwVDE3OjUyOjI5LjY2MzEzNDc1M1oiLCJyZXF1ZXN0X2luZm8iOnsiaWQiOiJndHJhY2VpZF9haHFMU2w0cThtdTRNTHJ4ekxQaCIsIm1ldGhvZCI6Ii9jb250cm9sbGVyLnNlcnZlcnMuc2VydmljZXMudjEuU2VydmVyQ29vcmRpbmF0aW9uU2VydmljZS9TdGF0dXMifSwicmVxdWVzdCI6eyJkZXRhaWxzIjp7Indvcmtlcl9zdGF0dXMiOnsibmFtZSI6IndvcmtlciIsImRlc2NyaXB0aW9uIjoiQSB3b3JrZXIgZm9yIGEgZG9ja2VyIGRlbW8iLCJhZGRyZXNzIjoibG9jYWxob3N0OjkyMDIiLCJrZXlfaWQiOiJwYXNzd29yZC1jcmluZ2luZy1oYXppbHktc2FuZGJhci1maXZlLWJsYXRhbmN5LXJlYXBwcm92ZS1maWZ0ZWVuIiwicmVsZWFzZV92ZXJzaW9uIjoiQm91bmRhcnkgdjAuMTcuMSIsIm9wZXJhdGlvbmFsX3N0YXRlIjoiYWN0aXZlIiwibG9jYWxfc3RvcmFnZV9zdGF0ZSI6Im5vdCBjb25maWd1cmVkIn19fSwicmVzcG9uc2UiOnsiZGV0YWlscyI6eyJjYWxjdWxhdGVkX3Vwc3RyZWFtcyI6W3sidHlwZSI6MSwiYWRkcmVzcyI6ImJvdW5kYXJ5OjkyMDEifV0sIndvcmtlcl9pZCI6IndfWGxDWDhiT1dzMiIsImF1dGhvcml6ZWRfd29ya2VycyI6e30sImF1dGhvcml6ZWRfZG93bnN0cmVhbV93b3JrZXJzIjp7fX19fSwiZGF0YWNvbnRlbnR5cGUiOiJhcHBsaWNhdGlvbi9jbG91ZGV2ZW50cyIsInRpbWUiOiIyMDI0LTA4LTMwVDE3OjUyOjQwLjA0NzIwNTY3NVoifQo","serialized_hmac":"hmac-sha256:4mzVrP3iPkgRinHG5nQFT5-wQLAasgveV4WQ79OSVcM"}
{"id":"GKfN3bPsBG","source":"https://hashicorp.com/boundary/boundary/controller","specversion":"1.0","type":"audit","data":{"id":"e_pZlwjXN2KT","version":"v0.1","type":"APIRequest","timestamp":"2024-08-30T17:52:29.663134753Z","request_info":{"id":"gtraceid_ahqLSl4q8mu4MLrxzLPh","method":"/controller.servers.services.v1.ServerCoordinationService/Status"},"request":{"details":{"worker_status":{"name":"worker","description":"A worker for a docker demo","address":"localhost:9202","key_id":"password-cringing-hazily-sandbar-five-blatancy-reapprove-fifteen","release_version":"Boundary v0.17.1","operational_state":"active","local_storage_state":"not configured"}}},"response":{"details":{"calculated_upstreams":[{"type":1,"address":"boundary:9201"}],"worker_id":"w_XlCX8bOWs2","authorized_workers":{},"authorized_downstream_workers":{}}}},"datacontentype":"application/cloudevents","time":"2024-08-30T17:52:40.047608633Z","serialized":"eyJpZCI6IkdLZk4zYlBzQkciLCJzb3VyY2UiOiJodHRwczovL2hhc2hpY29ycC5jb20vYm91bmRhcnkvYm91bmRhcnkvY29udHJvbGxlciIsInNwZWN2ZXJzaW9uIjoiMS4wIiwidHlwZSI6ImF1ZGl0IiwiZGF0YSI6eyJpZCI6ImVfcFpsd2pYTjJLVCIsInZlcnNpb24iOiJ2MC4xIiwidHlwZSI6IkFQSVJlcXVlc3QiLCJ0aW1lc3RhbXAiOiIyMDI0LTA4LTMwVDE3OjUyOjI5LjY2MzEzNDc1M1oiLCJyZXF1ZXN0X2luZm8iOnsiaWQiOiJndHJhY2VpZF9haHFMU2w0cThtdTRNTHJ4ekxQaCIsIm1ldGhvZCI6Ii9jb250cm9sbGVyLnNlcnZlcnMuc2VydmljZXMudjEuU2VydmVyQ29vcmRpbmF0aW9uU2VydmljZS9TdGF0dXMifSwicmVxdWVzdCI6eyJkZXRhaWxzIjp7Indvcmtlcl9zdGF0dXMiOnsibmFtZSI6IndvcmtlciIsImRlc2NyaXB0aW9uIjoiQSB3b3JrZXIgZm9yIGEgZG9ja2VyIGRlbW8iLCJhZGRyZXNzIjoibG9jYWxob3N0OjkyMDIiLCJrZXlfaWQiOiJwYXNzd29yZC1jcmluZ2luZy1oYXppbHktc2FuZGJhci1maXZlLWJsYXRhbmN5LXJlYXBwcm92ZS1maWZ0ZWVuIiwicmVsZWFzZV92ZXJzaW9uIjoiQm91bmRhcnkgdjAuMTcuMSIsIm9wZXJhdGlvbmFsX3N0YXRlIjoiYWN0aXZlIiwibG9jYWxfc3RvcmFnZV9zdGF0ZSI6Im5vdCBjb25maWd1cmVkIn19fSwicmVzcG9uc2UiOnsiZGV0YWlscyI6eyJjYWxjdWxhdGVkX3Vwc3RyZWFtcyI6W3sidHlwZSI6MSwiYWRkcmVzcyI6ImJvdW5kYXJ5OjkyMDEifV0sIndvcmtlcl9pZCI6IndfWGxDWDhiT1dzMiIsImF1dGhvcml6ZWRfd29ya2VycyI6e30sImF1dGhvcml6ZWRfZG93bnN0cmVhbV93b3JrZXJzIjp7fX19fSwiZGF0YWNvbnRlbnR5cGUiOiJhcHBsaWNhdGlvbi9jbG91ZGV2ZW50cyIsInRpbWUiOiIyMDI0LTA4LTMwVDE3OjUyOjQwLjA0NzYwODYzM1oifQo","serialized_hmac":"hmac-sha256:QOqM0MZ9jjNolJ4R1B3vfBS7_ieDQ_66MZ0IA5eLuG0"}
{"id":"FOhxLpBk03","source":"https://hashicorp.com/boundary/boundary/controller","specversion":"1.0","type":"audit","data":{"id":"e_fgFZub00ls","version":"v0.1","type":"APIRequest","timestamp":"2024-08-30T17:52:31.584100879Z","request_info":{"id":"gtraceid_TwEKTSE5bdd8TOKjsQmi","method":"/controller.servers.services.v1.ServerCoordinationService/Status"},"request":{"details":{"worker_status":{"name":"worker","description":"A worker for a docker demo","address":"localhost:9202","key_id":"password-cringing-hazily-sandbar-five-blatancy-reapprove-fifteen","release_version":"Boundary v0.17.1","operational_state":"active","local_storage_state":"not configured"}}},"response":{"details":{"calculated_upstreams":[{"type":1,"address":"boundary:9201"}],"worker_id":"w_XlCX8bOWs2","authorized_workers":{},"authorized_downstream_workers":{}}}},"datacontentype":"application/cloudevents","time":"2024-08-30T17:52:42.054169134Z","serialized":"eyJpZCI6IkZPaHhMcEJrMDMiLCJzb3VyY2UiOiJodHRwczovL2hhc2hpY29ycC5jb20vYm91bmRhcnkvYm91bmRhcnkvY29udHJvbGxlciIsInNwZWN2ZXJzaW9uIjoiMS4wIiwidHlwZSI6ImF1ZGl0IiwiZGF0YSI6eyJpZCI6ImVfZmdGWnViMDBscyIsInZlcnNpb24iOiJ2MC4xIiwidHlwZSI6IkFQSVJlcXVlc3QiLCJ0aW1lc3RhbXAiOiIyMDI0LTA4LTMwVDE3OjUyOjMxLjU4NDEwMDg3OVoiLCJyZXF1ZXN0X2luZm8iOnsiaWQiOiJndHJhY2VpZF9Ud0VLVFNFNWJkZDhUT0tqc1FtaSIsIm1ldGhvZCI6Ii9jb250cm9sbGVyLnNlcnZlcnMuc2VydmljZXMudjEuU2VydmVyQ29vcmRpbmF0aW9uU2VydmljZS9TdGF0dXMifSwicmVxdWVzdCI6eyJkZXRhaWxzIjp7Indvcmtlcl9zdGF0dXMiOnsibmFtZSI6IndvcmtlciIsImRlc2NyaXB0aW9uIjoiQSB3b3JrZXIgZm9yIGEgZG9ja2VyIGRlbW8iLCJhZGRyZXNzIjoibG9jYWxob3N0OjkyMDIiLCJrZXlfaWQiOiJwYXNzd29yZC1jcmluZ2luZy1oYXppbHktc2FuZGJhci1maXZlLWJsYXRhbmN5LXJlYXBwcm92ZS1maWZ0ZWVuIiwicmVsZWFzZV92ZXJzaW9uIjoiQm91bmRhcnkgdjAuMTcuMSIsIm9wZXJhdGlvbmFsX3N0YXRlIjoiYWN0aXZlIiwibG9jYWxfc3RvcmFnZV9zdGF0ZSI6Im5vdCBjb25maWd1cmVkIn19fSwicmVzcG9uc2UiOnsiZGV0YWlscyI6eyJjYWxjdWxhdGVkX3Vwc3RyZWFtcyI6W3sidHlwZSI6MSwiYWRkcmVzcyI6ImJvdW5kYXJ5OjkyMDEifV0sIndvcmtlcl9pZCI6IndfWGxDWDhiT1dzMiIsImF1dGhvcml6ZWRfd29ya2VycyI6e30sImF1dGhvcml6ZWRfZG93bnN0cmVhbV93b3JrZXJzIjp7fX19fSwiZGF0YWNvbnRlbnR5cGUiOiJhcHBsaWNhdGlvbi9jbG91ZGV2ZW50cyIsInRpbWUiOiIyMDI0LTA4LTMwVDE3OjUyOjQyLjA1NDE2OTEzNFoifQo","serialized_hmac":"hmac-sha256:xrYGZgzDfInsDQu3UNpZzQdWuQPfdiD_0gOAquChORY"}
{"id":"6uZKF9kalD","source":"https://hashicorp.com/boundary/boundary/controller","specversion":"1.0","type":"audit","data":{"id":"e_fgFZub00ls","version":"v0.1","type":"APIRequest","timestamp":"2024-08-30T17:52:31.584100879Z","request_info":{"id":"gtraceid_TwEKTSE5bdd8TOKjsQmi","method":"/controller.servers.services.v1.ServerCoordinationService/Status"},"request":{"details":{"worker_status":{"name":"worker","description":"A worker for a docker demo","address":"localhost:9202","key_id":"password-cringing-hazily-sandbar-five-blatancy-reapprove-fifteen","release_version":"Boundary v0.17.1","operational_state":"active","local_storage_state":"not configured"}}},"response":{"details":{"calculated_upstreams":[{"type":1,"address":"boundary:9201"}],"worker_id":"w_XlCX8bOWs2","authorized_workers":{},"authorized_downstream_workers":{}}}},"datacontentype":"application/cloudevents","time":"2024-08-30T17:52:42.054623926Z","serialized":"eyJpZCI6IjZ1WktGOWthbEQiLCJzb3VyY2UiOiJodHRwczovL2hhc2hpY29ycC5jb20vYm91bmRhcnkvYm91bmRhcnkvY29udHJvbGxlciIsInNwZWN2ZXJzaW9uIjoiMS4wIiwidHlwZSI6ImF1ZGl0IiwiZGF0YSI6eyJpZCI6ImVfZmdGWnViMDBscyIsInZlcnNpb24iOiJ2MC4xIiwidHlwZSI6IkFQSVJlcXVlc3QiLCJ0aW1lc3RhbXAiOiIyMDI0LTA4LTMwVDE3OjUyOjMxLjU4NDEwMDg3OVoiLCJyZXF1ZXN0X2luZm8iOnsiaWQiOiJndHJhY2VpZF9Ud0VLVFNFNWJkZDhUT0tqc1FtaSIsIm1ldGhvZCI6Ii9jb250cm9sbGVyLnNlcnZlcnMuc2VydmljZXMudjEuU2VydmVyQ29vcmRpbmF0aW9uU2VydmljZS9TdGF0dXMifSwicmVxdWVzdCI6eyJkZXRhaWxzIjp7Indvcmtlcl9zdGF0dXMiOnsibmFtZSI6IndvcmtlciIsImRlc2NyaXB0aW9uIjoiQSB3b3JrZXIgZm9yIGEgZG9ja2VyIGRlbW8iLCJhZGRyZXNzIjoibG9jYWxob3N0OjkyMDIiLCJrZXlfaWQiOiJwYXNzd29yZC1jcmluZ2luZy1oYXppbHktc2FuZGJhci1maXZlLWJsYXRhbmN5LXJlYXBwcm92ZS1maWZ0ZWVuIiwicmVsZWFzZV92ZXJzaW9uIjoiQm91bmRhcnkgdjAuMTcuMSIsIm9wZXJhdGlvbmFsX3N0YXRlIjoiYWN0aXZlIiwibG9jYWxfc3RvcmFnZV9zdGF0ZSI6Im5vdCBjb25maWd1cmVkIn19fSwicmVzcG9uc2UiOnsiZGV0YWlscyI6eyJjYWxjdWxhdGVkX3Vwc3RyZWFtcyI6W3sidHlwZSI6MSwiYWRkcmVzcyI6ImJvdW5kYXJ5OjkyMDEifV0sIndvcmtlcl9pZCI6IndfWGxDWDhiT1dzMiIsImF1dGhvcml6ZWRfd29ya2VycyI6e30sImF1dGhvcml6ZWRfZG93bnN0cmVhbV93b3JrZXJzIjp7fX19fSwiZGF0YWNvbnRlbnR5cGUiOiJhcHBsaWNhdGlvbi9jbG91ZGV2ZW50cyIsInRpbWUiOiIyMDI0LTA4LTMwVDE3OjUyOjQyLjA1NDYyMzkyNloifQo","serialized_hmac":"hmac-sha256:X87Pd_c0Pc2mhYIjssHFzwzbiXQF7IN7LIfAnU9Hb7k"}

...
... More Output ...
...
The contents of this file should also be available within the
learn-boundary-event-logging/auditlogs/controller.log file on your local
machine.
Use the auditlogs/ directory to view the log files for the rest of this tutorial.
Event sink filtering
Event sinks can be configured to filter events, so that a subset of events can be sent to a sink. This is useful for tracking when Boundary produces certain events relevant to operators or sysadmins, such as authentication or session management events.
For example, below is an authentication event:
2024-08-30 12:05:38 {"id":"wn4hB1PCRo","source":"https://hashicorp.com/boundary/boundary/controller","specversion":"1.0","type":"observation","data":{"latency-ms":10.100542,"request":{"details":{"auth_method_id":"ampw_zNOuLa8W9T","Attrs":{"PasswordLoginAttributes":{}}}},"request_info":{"id":"gtraceid_XWsjmYNpwrXvMWAqsdPK","method":"POST","path":"/v1/auth-methods/ampw_zNOuLa8W9T:authenticate","client_ip":"192.168.65.1"},"response":{"details":null},"start":"2024-08-30T18:05:38.423733466Z","status":401,"stop":"2024-08-30T18:05:38.433834007Z","version":"v0.1"},"datacontentype":"application/cloudevents","time":"2024-08-30T18:05:38.433896591Z"}
For authentication events, the "path" for the API request contains
:authenticate. In this example the full "path" is
"/v1/auth-methods/ampw_zNOuLa8W9T:authenticate".
To create a sink for these events, the following filter captures events with a
"path" containing :authenticate:
"/data/request_info/path" contains ":authenticate"
Define an authentication sink
Next, define a new file sink that only captures authentication events.
Open the compose/controller.hcl config file.
Uncomment lines 88 - 100, which define the following sink:
sink {
  name = "auth-sink"
  description = "Authentications sent to a file"
  event_types = ["observation"]
  format = "cloudevents-json"
  allow_filters = [
    "\"/data/request_info/path\" contains \":authenticate\""
  ]
  file {
    path = "/logs/"
    file_name = "auth.log"
  }
}
Save this file.
Notice the allow_filters syntax for authentication events:
allow_filters = [
  "\"/data/request_info/path\" contains \":authenticate\""
]
The allow_filters sink attribute is a logical "or" operator, meaning that only
the defined events will be captured. Sinks also support the deny_filters
attribute, which instead defines what events should not be captured. Event
sink filtering uses the standard filter
syntax used elsewhere
in Boundary.
The earlier filter:
"/data/request_info/path" contains ":authenticate"
must then be written as:
"\"/data/request_info/path\" contains \":authenticate\""
Use escape syntax when defining any filters within a Boundary HCL config file.
Restart the controller to apply the new config:
$ docker compose restart controller
[+] Running 1/1
 ⠿ Container boundary-controller-1  Started
Next, authenticate as user1 using the password password.
$ boundary authenticate password -login-name user1
Please enter the password (it will be hidden): <password>

Authentication information:
  Account ID:      acctpw_JQXp0QHxQL
  Auth Method ID:  ampw_f9LSI9eqCK
  Expiration Time: Thu, 26 May 2022 11:36:27 MDT
  User ID:         u_RlkqMP6jUv

The token was successfully stored in the chosen keyring and is not displayed here.
Check the shared directory and locate the new
learn-boundary-event-logging/auditlogs/auth.log file. It should contain a
single event from the recent authentication as user1. Future authentication
events will be logged here, too.
Define an authorize session sink
Another useful event sink might be dedicated to requests to authorize sessions
to targets. These events are already captured as audit events in the
controller's log file.
An example of a session authorization request is printed below.
2024-08-30 12:10:24 {"id":"0GBBXaY2D4","source":"https://hashicorp.com/boundary/boundary/controller","specversion":"1.0","type":"observation","data":{"latency-ms":44.052,"request":{"details":{"id":"postgres"}},"request_info":{"id":"gtraceid_Yvt79F51LKE8W4imzOs0","method":"POST","path":"/v1/targets/postgres:authorize-session","public_id":"at_TL7nVrdRPp","client_ip":"192.168.65.1"},"response":{"details":{"item":{"session_id":"s_ExxKbmjeas","target_id":"ttcp_PWksErb3NK","scope":{"id":"p_AvRDDqQdNf","type":"project","parent_scope_id":"o_PF7378wPb7"},"created_time":{"seconds":1725041424,"nanos":858907000},"user_id":"u_BdO67SfUme","host_set_id":"hsst_WZG8uKPT0P","host_id":"hst_lkXEUCfRTt","type":"tcp","endpoint_port":5432,"expiration":{"seconds":1725041724,"nanos":856973000}}}},"start":"2024-08-30T18:10:24.834328709Z","status":200,"stop":"2024-08-30T18:10:24.878380709Z","version":"v0.1"},"datacontentype":"application/cloudevents","time":"2024-08-30T18:10:24.878426709Z"}
For session authorization events, the "path" for the API request contains
:authorize-session. In this example the full "path" is
"/v1/targets/postgres:authorize-session".
To create a sink for these events, the following filter captures events with a
"path" containing :authorize-session:
"/data/request_info/path" contains ":authorize-session"
In addition to authorizations, Boundary sessions also produce the following events:
- AuthorizeConnection
- ActivateSession
- ConnectConnection
- LookupSession
- CancelSession
- CloseConnection
For these session events, the "method" for the API request contains
SessionService. An example of an AuthorizeConnection request is printed below:
{"id":"fs4JJS6qE4","source":"https://hashicorp.com/boundary/docker-controller","specversion":"1.0","type":"audit","data":{"id":"e_0DeWUzwsLZ","version":"v0.1","type":"APIRequest","timestamp":"2022-05-18T20:05:24.170444737Z","request_info":{"id":"gtraceid_6mnTRg2NB0FOvbfSc4Vh","method":"/controller.servers.services.v1.SessionService/AuthorizeConnection"},"request":{"details":{"session_id":"s_0US6KDcGuP","worker_id":"worker"}},"response":{"details":{"connection_id":"sc_WV6ynVQx0m","status":1,"connections_left":-1}}},"datacontentype":"application/cloudevents","time":"2022-05-18T20:05:35.791128461Z","serialized":"eyJpZCI6ImZzNEpKUzZxRTQiLCJzb3VyY2UiOiJodHRwczovL2hhc2hpY29ycC5jb20vYm91bmRhcnkvZG9ja2VyLWNvbnRyb2xsZXIiLCJzcGVjdmVyc2lvbiI6IjEuMCIsInR5cGUiOiJhdWRpdCIsImRhdGEiOnsiaWQiOiJlXzBEZVdVendzTFoiLCJ2ZXJzaW9uIjoidjAuMSIsInR5cGUiOiJBUElSZXF1ZXN0IiwidGltZXN0YW1wIjoiMjAyMi0wNS0xOFQyMDowNToyNC4xNzA0NDQ3MzdaIiwicmVxdWVzdF9pbmZvIjp7ImlkIjoiZ3RyYWNlaWRfNm1uVFJnMk5CMEZPdmJmU2M0VmgiLCJtZXRob2QiOiIvY29udHJvbGxlci5zZXJ2ZXJzLnNlcnZpY2VzLnYxLlNlc3Npb25TZXJ2aWNlL0F1dGhvcml6ZUNvbm5lY3Rpb24ifSwicmVxdWVzdCI6eyJkZXRhaWxzIjp7InNlc3Npb25faWQiOiJzXzBVUzZLRGNHdVAiLCJ3b3JrZXJfaWQiOiJ3b3JrZXIifX0sInJlc3BvbnNlIjp7ImRldGFpbHMiOnsiY29ubmVjdGlvbl9pZCI6InNjX1dWNnluVlF4MG0iLCJzdGF0dXMiOjEsImNvbm5lY3Rpb25zX2xlZnQiOi0xfX19LCJkYXRhY29udGVudHlwZSI6ImFwcGxpY2F0aW9uL2Nsb3VkZXZlbnRzIiwidGltZSI6IjIwMjItMDUtMThUMjA6MDU6MzUuNzkxMTI4NDYxWiJ9Cg","serialized_hmac":"hmac-sha256:JZMWsDbduTlhHg3jPmqNnoIpH0Eek_lvbEqdllp82kA"}
In this example the full "method" is
"/controller.servers.services.v1.SessionService/AuthorizeConnection".
The following filter captures events related to session management by filtering
for a "method" containing SessionService:
"/data/request_info/method" contains "SessionService"
Now that you understand the filter syntax needed to capture session events, define a new file sink that captures session events, including authorizations and session services.
Open the compose/controller.hcl config file.
Copy the following sink and paste it beneath the auth-sink in the
compose/controller.hcl:
sink {
  name = "session-sink"
  description = "Authorize session requests and services sent to a file"
  event_types = ["audit"]
  format = "cloudevents-json"
  allow_filters = [
    "\"/data/request_info/path\" contains \":authorize-session\"",
    "\"/data/request_info/method\" contains \"SessionService\"",
  ]
  file {
    path = "/logs/"
    file_name = "sessions.log"
  }
}
Ensure that the session sink is pasted within the events{} stanza. There
should be a closing } following the copy-paste of the above filter.
Note that escape syntax is used again when defining the filter.
The full contents of the events stanza within the compose/controller.hcl file
is printed below for reference.
controller.hcl
events {
  audit_enabled        = true
  observations_enabled = true
  sysevents_enabled    = true
  telemetry_enabled    = true

  sink "stderr" {
    name        = "all-events"
    description = "All events sent to stderr"
    event_types = ["*"]
    format      = "cloudevents-json"
  }

  sink {
    name        = "controller-audit-sink"
    description = "Audit sent to a file"
    event_types = ["audit"]
    format      = "cloudevents-json"

    file {
      path      = "/logs"
      file_name = "controller.log"
    }

    audit_config {
      audit_filter_overrides {
        secret    = "encrypt"
        sensitive = "hmac-sha256"
      }
    }
  }

  sink {
    name = "auth-sink"
    description = "Authentications sent to a file"
    event_types = ["observation"]
    format = "cloudevents-json"
    allow_filters = [
      "\"/data/request_info/path\" contains \":authenticate\""
    ]
    file {
      path = "/logs/"
      file_name = "auth.log"
    }
  }

  sink {
    name = "session-sink"
    description = "Authorize session requests and services sent to a file"
    event_types = ["audit"]
    format = "cloudevents-json"
    allow_filters = [
      "\"/data/request_info/path\" contains \":authorize-session\"",
      "\"/data/request_info/method\" contains \"SessionService\"",
    ]
    file {
      path = "/logs/"
      file_name = "sessions.log"
    }
  }
}
Save this file and restart the controller container to apply the new configuration.
$ docker compose restart controller
[+] Running 1/1
 ⠿ Container boundary-controller-1  Started
To test this event sink, a postgres target is included in the Docker Compose deployment.
Wait a moment for the controller to restart, and then establish a session to
the postgres target as the postgres user using boundary connect postgres.
Enter the password postgres when prompted.
$ boundary connect postgres -target-name postgres -target-scope-name databases -username postgres
Password for user postgres:
psql (14.2, server 13.2 (Debian 13.2-1.pgdg100+1))
Type "help" for help.

postgres=#
Enter exit to close the connection.
Check the shared auditlogs/ directory and locate the new
learn-boundary-event-logging/auditlogs/sessions.log file.
It should contain an authorize-session event and several SessionService
events, including LookupSession, ActivateSession, AuthorizeConnection,
CloseConnection and CancelConnection. The sink filter defined earlier
captures these events, which all contain SessionService in the
data.request_info.method JSON data. If the operator only wanted to capture a
subset of these events, a more granular filter could be created to allow only
those events, such as AuthorizeConnection.
Define a worker sink
Next you will set up an event sink for the worker.
Begin by checking the logs on the boundary-worker-1 container.
$ docker compose logs worker
worker-1  | Couldn't start Boundary with IPC_LOCK. Disabling IPC_LOCK, please use --privileged or --cap-add IPC_LOCK
worker-1  | ==> Boundary server configuration:
worker-1  |
worker-1  |            [Worker-Auth] Aead Type: aes-gcm
worker-1  |                                Cgo: disabled
worker-1  |                         Listener 1: tcp (addr: "worker:9202", max_request_duration: "1m30s", purpose: "proxy")
worker-1  |                          Log Level: info
worker-1  |                              Mlock: supported: true, enabled: false
worker-1  |                            Version: Boundary v0.17.1
worker-1  |                        Version Sha: 6851256561b50778eae55144cc6e5be96ce23232
worker-1  |         Worker Auth Current Key Id: couch-elude-sublease-cement-fondue-bodacious-swiftly-magnetic
worker-1  |   Worker Auth Registration Request: pdZ5SAAebKa9DmnokkNu5EuBPLV6VnM4QbsLscbsKWqmFr9tfLmUzkcqwu1saYjd1sAQeRcSWrZezoAJNnEuTnJNpKJKtSUDPLkT8Q7bbw7yRXPdQ5LH37pHjxuCwkrjrA41DiSnSRpYniepwfrRfJN5bUjnSsNeJtoS8J16ckS6CJtuqThNQpXnFncgi7NfjcLG3ZeskjBvXhBdKGH1jJ4CrcgXKWpSWcnH1HhMBkUB8wddThEoz5zLuFibSqiRMh8vKxqkfEs9N88mhve6RjxA42rLmzyvBbqE98D
worker-1  |           Worker Public Proxy Addr: localhost:9202
worker-1  |
worker-1  | ==> Boundary server started! Log data will stream in below:
worker-1  |
worker-1  | {"id":"tIJNTrrxkT","source":"https://hashicorp.com/boundary/worker/worker","specversion":"1.0","type":"system","data":{"version":"v0.1","op":"worker.(Worker).startAuthRotationTicking","data":{"msg":"starting auth rotation ticking"}},"datacontentype":"application/cloudevents","time":"2024-08-30T17:50:14.222310344Z"}
worker-1  | {"id":"RGUbbUFOQO","source":"https://hashicorp.com/boundary/worker/worker","specversion":"1.0","type":"system","data":{"version":"v0.1","op":"worker.(Worker).upstreamDialerFunc","data":{"msg":"worker has successfully authenticated"}},"datacontentype":"application/cloudevents","time":"2024-08-30T17:50:14.235077719Z"}
worker-1  | {"id":"dFWbCx4SDZ","source":"https://hashicorp.com/boundary/worker/worker","specversion":"1.0","type":"system","data":{"version":"v0.1","op":"worker.(Worker).updateAddrs","data":{"msg":"Upstreams after first status set to: [boundary:9201]"}},"datacontentype":"application/cloudevents","time":"2024-08-30T17:50:14.248212885Z"}
worker-1  | {"id":"QufEckBlrW","source":"https://hashicorp.com/boundary/worker/worker","specversion":"1.0","type":"system","data":{"version":"v0.1","op":"worker.(Worker).startAuthRotationTicking","data":{"ca_cert_current_key_id":"clergyman-remix-retaining-smitten-wok-unisexual-endowment-scorch","ca_cert_current_not_after":"2024-09-13T17:55:08Z","ca_cert_current_not_before":"2024-08-30T17:45:08Z","ca_cert_next_key_id":"groggily-straining-partly-saucy-catcher-cupbearer-murmuring-tapping","ca_cert_next_not_after":"2024-09-20T17:57:38Z","ca_cert_next_not_before":"2024-09-06T17:47:38Z","intuited_rotation_interval":"168h2m30s","last_rotation":"0001-01-01T00:00:00Z","leaf_cert_current_cert_id":"brunette-rocket-untangled-shorty-urging-tidings-yin-patrol","leaf_cert_current_key_id":"couch-elude-sublease-cement-fondue-bodacious-swiftly-magnetic","leaf_cert_current_not_after":"2024-09-13T17:55:08Z","leaf_cert_current_not_before":"2024-08-30T17:45:08Z","leaf_cert_next_cert_id":"junction-clothing-unplanted-wooing-tranquil-obedient-lake-unsocial","leaf_cert_next_key_id":"couch-elude-sublease-cement-fondue-bodacious-swiftly-magnetic","leaf_cert_next_not_after":"2024-09-20T17:57:38Z","leaf_cert_next_not_before":"2024-09-06T17:47:38Z","msg":"checking if worker auth should rotate","next_rotation":"2024-08-30T17:50:20Z","now":"2024-08-30T17:50:20Z"}},"datacontentype":"application/cloudevents","time":"2024-08-30T17:50:20.223449805Z"}
worker-1  | {"id":"fha4Df9xgd","source":"https://hashicorp.com/boundary/worker/worker","specversion":"1.0","type":"system","data":{"version":"v0.1","op":"worker.rotateWorkerAuth","data":{"ca_cert_current_key_id":"clergyman-remix-retaining-smitten-wok-unisexual-endowment-scorch","ca_cert_current_not_after":"2024-09-13T17:55:08Z","ca_cert_current_not_before":"2024-08-30T17:45:08Z","ca_cert_next_key_id":"groggily-straining-partly-saucy-catcher-cupbearer-murmuring-tapping","ca_cert_next_not_after":"2024-09-20T17:57:38Z","ca_cert_next_not_before":"2024-09-06T17:47:38Z","leaf_cert_current_cert_id":"gulf-explode-bouncing-hatred-overcoat-unfrozen-rimless-eggnog","leaf_cert_current_key_id":"password-cringing-hazily-sandbar-five-blatancy-reapprove-fifteen","leaf_cert_current_not_after":"2024-09-13T17:55:08Z","leaf_cert_current_not_before":"2024-08-30T17:45:08Z","leaf_cert_next_cert_id":"cytoplast-throwing-upwind-munchkin-oblivious-scabby-spirits-outsource","leaf_cert_next_key_id":"password-cringing-hazily-sandbar-five-blatancy-reapprove-fifteen","leaf_cert_next_not_after":"2024-09-20T17:57:38Z","leaf_cert_next_not_before":"2024-09-06T17:47:38Z","msg":"rotate worker auth job finished successfully"}},"datacontentype":"application/cloudevents","time":"2024-08-30T17:50:20.230996555Z"}
worker-1  | {"id":"rhKZORqvGG","source":"https://hashicorp.com/boundary/worker/worker","specversion":"1.0","type":"system","data":{"version":"v0.1","op":"worker.(Worker).startAuthRotationTicking","data":{"msg":"worker credentials rotated","next_rotation":"2024-09-03T05:51:35.22343943Z"}},"datacontentype":"application/cloudevents","time":"2024-08-30T17:50:20.23110368Z"}
worker-1  | {"id":"YJYCXGQKz0","source":"https://hashicorp.com/boundary/worker/worker","specversion":"1.0","type":"error","data":{"error":"(nodeenrollment.protocol.Dial) unable to dial to server: (nodeenrollment.protocol.Dial) unable to dial to server: dial tcp 172.18.0.7:9201: connect: connection refused","error_fields":{},"id":"e_jQABRqJG3H","version":"v0.1","op":"worker.(Worker).upstreamDialerFunc"},"datacontentype":"application/cloudevents","time":"2024-08-30T18:09:12.761864801Z"}
worker-1  | {"id":"VUW4YZTk0y","source":"https://hashicorp.com/boundary/worker/worker","specversion":"1.0","type":"error","data":{"error":"worker.(Worker).upstreamDialerFunc: unknown, unknown: error #0: (nodeenrollment.protocol.Dial) unable to dial to server: (nodeenrollment.protocol.Dial) unable to dial to server: dial tcp 172.18.0.7:9201: connect: connection refused","error_fields":{"Code":0,"Msg":"","Op":"worker.(Worker).upstreamDialerFunc","Wrapped":{}},"id":"e_xtiSUnDBGY","version":"v0.1","op":"worker.(Worker).upstreamDialerFunc"},"datacontentype":"application/cloudevents","time":"2024-08-30T18:09:12.762106551Z"}
worker-1  | {"id":"WEen56H11J","source":"https://hashicorp.com/boundary/worker/worker","specversion":"1.0","type":"error","data":{"error":"rpc error: code = Unavailable desc = last connection error: connection error: desc = \"transport: Error while dialing: worker.(Worker).upstreamDialerFunc: unknown, unknown: error #0: (nodeenrollment.protocol.Dial) unable to dial to server: (nodeenrollment.protocol.Dial) unable to dial to server: dial tcp 172.18.0.7:9201: connect: connection refused\"","error_fields":{},"id":"e_WWa5Oqe7gT","version":"v0.1","op":"worker.(Worker).sendWorkerStatus","info":{"msg":"error making status request to controller"}},"datacontentype":"application/cloudevents","time":"2024-08-30T18:09:12.904019218Z"}
worker-1  | {"id":"OEoB5uoynV","source":"https://hashicorp.com/boundary/worker/worker","specversion":"1.0","type":"error","data":{"error":"(nodeenrollment.protocol.Dial) unable to dial to server: (nodeenrollment.protocol.Dial) unable to dial to server: dial tcp 172.18.0.2:9201: connect: connection refused","error_fields":{},"id":"e_hB8Biuleko","version":"v0.1","op":"worker.(Worker).upstreamDialerFunc"},"datacontentype":"application/cloudevents","time":"2024-08-30T18:09:13.766989593Z"}
worker-1  | {"id":"J8L5lMCo7j","source":"https://hashicorp.com/boundary/worker/worker","specversion":"1.0","type":"error","data":{"error":"worker.(Worker).upstreamDialerFunc: unknown, unknown: error #0: (nodeenrollment.protocol.Dial) unable to dial to server: (nodeenrollment.protocol.Dial) unable to dial to server: dial tcp 172.18.0.2:9201: connect: connection refused","error_fields":{"Code":0,"Msg":"","Op":"worker.(Worker).upstreamDialerFunc","Wrapped":{}},"id":"e_wu5IoTanuY","version":"v0.1","op":"worker.(Worker).upstreamDialerFunc"},"datacontentype":"application/cloudevents","time":"2024-08-30T18:09:13.767316718Z"}
worker-1  | {"id":"a5g08N2ipg","source":"https://hashicorp.com/boundary/worker/worker","specversion":"1.0","type":"error","data":{"error":"rpc error: code = Unavailable desc = last connection error: connection error: desc = \"transport: Error while dialing: worker.(Worker).upstreamDialerFunc: unknown, unknown: error #0: (nodeenrollment.protocol.Dial) unable to dial to server: (nodeenrollment.protocol.Dial) unable to dial to server: dial tcp 172.18.0.2:9201: connect: connection refused\"","error_fields":{},"id":"e_E7TEGOM4rE","version":"v0.1","op":"worker.(Worker).sendWorkerStatus","info":{"msg":"error making status request to controller"}},"datacontentype":"application/cloudevents","time":"2024-08-30T18:09:14.91716626Z"}
worker-1  | {"id":"o1o6FMDma0","source":"https://hashicorp.com/boundary/worker/worker","specversion":"1.0","type":"error","data":{"error":"(nodeenrollment.protocol.Dial) unable to dial to server: (nodeenrollment.protocol.Dial) unable to dial to server: dial tcp 172.18.0.2:9201: connect: connection refused","error_fields":{},"id":"e_T2ZKggB9Dj","version":"v0.1","op":"worker.(Worker).upstreamDialerFunc"},"datacontentype":"application/cloudevents","time":"2024-08-30T18:09:15.145432802Z"}
worker-1  | {"id":"CH3QgjMsvp","source":"https://hashicorp.com/boundary/worker/worker","specversion":"1.0","type":"error","data":{"error":"worker.(Worker).upstreamDialerFunc: unknown, unknown: error #0: (nodeenrollment.protocol.Dial) unable to dial to server: (nodeenrollment.protocol.Dial) unable to dial to server: dial tcp 172.18.0.2:9201: connect: connection refused","error_fields":{"Code":0,"Msg":"","Op":"worker.(Worker).upstreamDialerFunc","Wrapped":{}},"id":"e_NgkjwrkyiT","version":"v0.1","op":"worker.(Worker).upstreamDialerFunc"},"datacontentype":"application/cloudevents","time":"2024-08-30T18:09:15.145623302Z"}
worker-1  | {"id":"wI14aDD1Fk","source":"https://hashicorp.com/boundary/worker/worker","specversion":"1.0","type":"error","data":{"error":"rpc error: code = Unavailable desc = last connection error: connection error: desc = \"transport: Error while dialing: worker.(Worker).upstreamDialerFunc: unknown, unknown: error #0: (nodeenrollment.protocol.Dial) unable to dial to server: (nodeenrollment.protocol.Dial) unable to dial to server: dial tcp 172.18.0.2:9201: connect: connection refused\"","error_fields":{},"id":"e_fVf0OMuW4T","version":"v0.1","op":"worker.(Worker).sendWorkerStatus","info":{"msg":"error making status request to controller"}},"datacontentype":"application/cloudevents","time":"2024-08-30T18:09:16.453657719Z"}
worker-1  | {"id":"6RG2CpZKef","source":"https://hashicorp.com/boundary/worker/worker","specversion":"1.0","type":"error","data":{"error":"(nodeenrollment.protocol.Dial) unable to dial to server: (nodeenrollment.protocol.Dial) unable to dial to server: dial tcp 172.18.0.2:9201: connect: connection refused","error_fields":{},"id":"e_A5cgkYdMKo","version":"v0.1","op":"worker.(Worker).upstreamDialerFunc"},"datacontentype":"application/cloudevents","time":"2024-08-30T18:09:16.664181053Z"}
worker-1  | {"id":"Vd2BKZkC4a","source":"https://hashicorp.com/boundary/worker/worker","specversion":"1.0","type":"error","data":{"error":"worker.(Worker).upstreamDialerFunc: unknown, unknown: error #0: (nodeenrollment.protocol.Dial) unable to dial to server: (nodeenrollment.protocol.Dial) unable to dial to server: dial tcp 172.18.0.2:9201: connect: connection refused","error_fields":{"Code":0,"Msg":"","Op":"worker.(Worker).upstreamDialerFunc","Wrapped":{}},"id":"e_MMGRdUi0J1","version":"v0.1","op":"worker.(Worker).upstreamDialerFunc"},"datacontentype":"application/cloudevents","time":"2024-08-30T18:09:16.66431097Z"}
worker-1  | {"id":"FGbYXoii02","source":"https://hashicorp.com/boundary/worker/worker","specversion":"1.0","type":"system","data":{"version":"v0.1","op":"worker.(Worker).upstreamDialerFunc","data":{"msg":"worker has successfully authenticated"}},"datacontentype":"application/cloudevents","time":"2024-08-30T18:09:18.510656804Z"}
worker-1  | {"id":"a0osrIXbZM","source":"https://hashicorp.com/boundary/worker/worker","specversion":"1.0","type":"system","data":{"version":"v0.1","op":"worker.(Worker).handleProxy","data":{"msg":"session successfully activated","session_id":"s_ExxKbmjeas"}},"datacontentype":"application/cloudevents","time":"2024-08-30T18:10:25.463593668Z"}
worker-1  | {"id":"i5xTfNiqcb","source":"https://hashicorp.com/boundary/worker/worker","specversion":"1.0","type":"system","data":{"version":"v0.1","op":"worker.(Worker).handleProxy","data":{"connection_id":"sc_ysMSi3dW5L","msg":"connection successfully authorized","session_id":"s_ExxKbmjeas"}},"datacontentype":"application/cloudevents","time":"2024-08-30T18:10:25.467492834Z"}
worker-1  | {"id":"pdWcsHfNiy","source":"https://hashicorp.com/boundary/worker/worker","specversion":"1.0","type":"system","data":{"version":"v0.1","op":"worker.(Worker).handleProxy","data":{"connection_id":"sc_ysMSi3dW5L","msg":"connection closed","session_id":"s_ExxKbmjeas"}},"datacontentype":"application/cloudevents","time":"2024-08-30T18:10:25.476502334Z"}
worker-1  | {"id":"eme01C0Khd","source":"https://hashicorp.com/boundary/worker/worker","specversion":"1.0","type":"system","data":{"version":"v0.1","op":"worker.(Worker).handleProxy","data":{"connection_id":"sc_pig78ghQKB","msg":"connection successfully authorized","session_id":"s_ExxKbmjeas"}},"datacontentype":"application/cloudevents","time":"2024-08-30T18:10:32.776498838Z"}
worker-1  | {"id":"XKSJLw4lU2","source":"https://hashicorp.com/boundary/worker/worker","specversion":"1.0","type":"system","data":{"version":"v0.1","op":"worker.(Worker).handleProxy","data":{"connection_id":"sc_pig78ghQKB","msg":"connection closed","session_id":"s_ExxKbmjeas"}},"datacontentype":"application/cloudevents","time":"2024-08-30T18:10:38.256032757Z"}
worker-1  | {"id":"j3hZutUdNY","source":"https://hashicorp.com/boundary/worker/worker","specversion":"1.0","type":"error","data":{"error":"(nodeenrollment.protocol.Dial) unable to dial to server: (nodeenrollment.protocol.Dial) unable to dial to server: dial tcp 172.18.0.2:9201: connect: connection refused","error_fields":{},"id":"e_6msSvL9HLo","version":"v0.1","op":"worker.(Worker).upstreamDialerFunc"},"datacontentype":"application/cloudevents","time":"2024-08-30T18:14:18.570612679Z"}
worker-1  | {"id":"AnFdHHcdA4","source":"https://hashicorp.com/boundary/worker/worker","specversion":"1.0","type":"error","data":{"error":"worker.(Worker).upstreamDialerFunc: unknown, unknown: error #0: (nodeenrollment.protocol.Dial) unable to dial to server: (nodeenrollment.protocol.Dial) unable to dial to server: dial tcp 172.18.0.2:9201: connect: connection refused","error_fields":{"Code":0,"Msg":"","Op":"worker.(Worker).upstreamDialerFunc","Wrapped":{}},"id":"e_sijwhH9lb7","version":"v0.1","op":"worker.(Worker).upstreamDialerFunc"},"datacontentype":"application/cloudevents","time":"2024-08-30T18:14:18.570710345Z"}
worker-1  | {"id":"3dBxA3BJAI","source":"https://hashicorp.com/boundary/worker/worker","specversion":"1.0","type":"error","data":{"error":"(nodeenrollment.protocol.Dial) unable to dial to server: (nodeenrollment.protocol.Dial) unable to dial to server: dial tcp 172.18.0.2:9201: connect: connection refused","error_fields":{},"id":"e_tezsAnFVeA","version":"v0.1","op":"worker.(Worker).upstreamDialerFunc"},"datacontentype":"application/cloudevents","time":"2024-08-30T18:14:19.576112929Z"}
worker-1  | {"id":"gteswAWW4A","source":"https://hashicorp.com/boundary/worker/worker","specversion":"1.0","type":"error","data":{"error":"worker.(Worker).upstreamDialerFunc: unknown, unknown: error #0: (nodeenrollment.protocol.Dial) unable to dial to server: (nodeenrollment.protocol.Dial) unable to dial to server: dial tcp 172.18.0.2:9201: connect: connection refused","error_fields":{"Code":0,"Msg":"","Op":"worker.(Worker).upstreamDialerFunc","Wrapped":{}},"id":"e_cHLWUFsefP","version":"v0.1","op":"worker.(Worker).upstreamDialerFunc"},"datacontentype":"application/cloudevents","time":"2024-08-30T18:14:19.576355513Z"}
worker-1  | {"id":"56hTgBBdJW","source":"https://hashicorp.com/boundary/worker/worker","specversion":"1.0","type":"error","data":{"error":"rpc error: code = Unavailable desc = last connection error: connection error: desc = \"transport: Error while dialing: worker.(Worker).upstreamDialerFunc: unknown, unknown: error #0: (nodeenrollment.protocol.Dial) unable to dial to server: (nodeenrollment.protocol.Dial) unable to dial to server: dial tcp 172.18.0.2:9201: connect: connection refused\"","error_fields":{},"id":"e_EmzuGClmbq","version":"v0.1","op":"worker.(Worker).sendWorkerStatus","info":{"msg":"error making status request to controller"}},"datacontentype":"application/cloudevents","time":"2024-08-30T18:14:20.020497513Z"}
worker-1  | {"id":"GMs1As7gfp","source":"https://hashicorp.com/boundary/worker/worker","specversion":"1.0","type":"error","data":{"error":"(nodeenrollment.protocol.Dial) unable to dial to server: (nodeenrollment.protocol.Dial) unable to dial to server: dial tcp 172.18.0.2:9201: connect: connection refused","error_fields":{},"id":"e_bJoba0GpK8","version":"v0.1","op":"worker.(Worker).upstreamDialerFunc"},"datacontentype":"application/cloudevents","time":"2024-08-30T18:14:20.539249388Z"}
worker-1  | {"id":"VMDodmTijs","source":"https://hashicorp.com/boundary/worker/worker","specversion":"1.0","type":"error","data":{"error":"worker.(Worker).upstreamDialerFunc: unknown, unknown: error #0: (nodeenrollment.protocol.Dial) unable to dial to server: (nodeenrollment.protocol.Dial) unable to dial to server: dial tcp 172.18.0.2:9201: connect: connection refused","error_fields":{"Code":0,"Msg":"","Op":"worker.(Worker).upstreamDialerFunc","Wrapped":{}},"id":"e_lBnnLYyAyP","version":"v0.1","op":"worker.(Worker).upstreamDialerFunc"},"datacontentype":"application/cloudevents","time":"2024-08-30T18:14:20.539462221Z"}
worker-1  | {"id":"DIx0SUdA3y","source":"https://hashicorp.com/boundary/worker/worker","specversion":"1.0","type":"error","data":{"error":"(nodeenrollment.protocol.Dial) unable to dial to server: (nodeenrollment.protocol.Dial) unable to dial to server: dial tcp 172.18.0.2:9201: connect: connection refused","error_fields":{},"id":"e_Yor52IMFhY","version":"v0.1","op":"worker.(Worker).upstreamDialerFunc"},"datacontentype":"application/cloudevents","time":"2024-08-30T18:14:22.2152515Z"}
worker-1  | {"id":"YTE1YporSr","source":"https://hashicorp.com/boundary/worker/worker","specversion":"1.0","type":"error","data":{"error":"worker.(Worker).upstreamDialerFunc: unknown, unknown: error #0: (nodeenrollment.protocol.Dial) unable to dial to server: (nodeenrollment.protocol.Dial) unable to dial to server: dial tcp 172.18.0.2:9201: connect: connection refused","error_fields":{"Code":0,"Msg":"","Op":"worker.(Worker).upstreamDialerFunc","Wrapped":{}},"id":"e_0ElCbNNYWO","version":"v0.1","op":"worker.(Worker).upstreamDialerFunc"},"datacontentype":"application/cloudevents","time":"2024-08-30T18:14:22.215681125Z"}
worker-1  | {"id":"AZVfs7q114","source":"https://hashicorp.com/boundary/worker/worker","specversion":"1.0","type":"error","data":{"error":"rpc error: code = Unavailable desc = last connection error: connection error: desc = \"transport: Error while dialing: worker.(Worker).upstreamDialerFunc: unknown, unknown: error #0: (nodeenrollment.protocol.Dial) unable to dial to server: (nodeenrollment.protocol.Dial) unable to dial to server: dial tcp 172.18.0.2:9201: connect: connection refused\"","error_fields":{},"id":"e_jK2zIGduSa","version":"v0.1","op":"worker.(Worker).sendWorkerStatus","info":{"msg":"error making status request to controller"}},"datacontentype":"application/cloudevents","time":"2024-08-30T18:14:22.330714041Z"}
worker-1  | {"id":"qoF6AWakgR","source":"https://hashicorp.com/boundary/worker/worker","specversion":"1.0","type":"error","data":{"error":"(nodeenrollment.protocol.Dial) unable to dial to server: (nodeenrollment.protocol.Dial) unable to dial to server: dial tcp 172.18.0.2:9201: connect: connection refused","error_fields":{},"id":"e_WPwARW09Ho","version":"v0.1","op":"worker.(Worker).upstreamDialerFunc"},"datacontentype":"application/cloudevents","time":"2024-08-30T18:14:23.645057084Z"}
worker-1  | {"id":"IKUmYBm6Bo","source":"https://hashicorp.com/boundary/worker/worker","specversion":"1.0","type":"error","data":{"error":"worker.(Worker).upstreamDialerFunc: unknown, unknown: error #0: (nodeenrollment.protocol.Dial) unable to dial to server: (nodeenrollment.protocol.Dial) unable to dial to server: dial tcp 172.18.0.2:9201: connect: connection refused","error_fields":{"Code":0,"Msg":"","Op":"worker.(Worker).upstreamDialerFunc","Wrapped":{}},"id":"e_alAEHMpXVm","version":"v0.1","op":"worker.(Worker).upstreamDialerFunc"},"datacontentype":"application/cloudevents","time":"2024-08-30T18:14:23.645266375Z"}
worker-1  | {"id":"5Es1Q0zLh0","source":"https://hashicorp.com/boundary/worker/worker","specversion":"1.0","type":"error","data":{"error":"rpc error: code = Unavailable desc = last connection error: connection error: desc = \"transport: Error while dialing: worker.(Worker).upstreamDialerFunc: unknown, unknown: error #0: (nodeenrollment.protocol.Dial) unable to dial to server: (nodeenrollment.protocol.Dial) unable to dial to server: dial tcp 172.18.0.2:9201: connect: connection refused\"","error_fields":{},"id":"e_7Yd1XDVqVq","version":"v0.1","op":"worker.(Worker).sendWorkerStatus","info":{"msg":"error making status request to controller"}},"datacontentype":"application/cloudevents","time":"2024-08-30T18:14:23.947862584Z"}
worker-1  | {"id":"avYzLVpAgJ","source":"https://hashicorp.com/boundary/worker/worker","specversion":"1.0","type":"system","data":{"version":"v0.1","op":"worker.(Worker).upstreamDialerFunc","data":{"msg":"worker has successfully authenticated"}},"datacontentype":"application/cloudevents","time":"2024-08-30T18:14:25.699193501Z"}
worker-1  | {"id":"9RWZMWKeIK","source":"https://hashicorp.com/boundary/worker/worker","specversion":"1.0","type":"system","data":{"version":"v0.1","op":"worker.(Worker).handleProxy","data":{"msg":"session successfully activated","session_id":"s_ap761llr4D"}},"datacontentype":"application/cloudevents","time":"2024-08-30T18:14:28.177785544Z"}
worker-1  | {"id":"uV6JUFuAmo","source":"https://hashicorp.com/boundary/worker/worker","specversion":"1.0","type":"system","data":{"version":"v0.1","op":"worker.(Worker).handleProxy","data":{"connection_id":"sc_UXPnFhaYPL","msg":"connection successfully authorized","session_id":"s_ap761llr4D"}},"datacontentype":"application/cloudevents","time":"2024-08-30T18:14:28.180463544Z"}
worker-1  | {"id":"xGPUbIMPTX","source":"https://hashicorp.com/boundary/worker/worker","specversion":"1.0","type":"system","data":{"version":"v0.1","op":"worker.(Worker).handleProxy","data":{"connection_id":"sc_UXPnFhaYPL","msg":"connection closed","session_id":"s_ap761llr4D"}},"datacontentype":"application/cloudevents","time":"2024-08-30T18:14:28.186711836Z"}
worker-1  | {"id":"9Kpled27hq","source":"https://hashicorp.com/boundary/worker/worker","specversion":"1.0","type":"system","data":{"version":"v0.1","op":"worker.(Worker).handleProxy","data":{"connection_id":"sc_ZTXL81aKkx","msg":"connection successfully authorized","session_id":"s_ap761llr4D"}},"datacontentype":"application/cloudevents","time":"2024-08-30T18:14:31.845043462Z"}
worker-1  | {"id":"MfhyLXj89H","source":"https://hashicorp.com/boundary/worker/worker","specversion":"1.0","type":"system","data":{"version":"v0.1","op":"worker.(Worker).handleProxy","data":{"connection_id":"sc_ZTXL81aKkx","msg":"connection closed","session_id":"s_ap761llr4D"}},"datacontentype":"application/cloudevents","time":"2024-08-30T18:14:33.962843547Z"}
You will notice several events related to session management sent to stderr with the default events configuration.
Open the compose/worker.hcl configuration file. Add the following events
stanza to the end of the file:
events {
  audit_enabled        = true
  observations_enabled = true
  sysevents_enabled    = true
  telemetry_enabled    = true

  sink "stderr" {
    name        = "all-events"
    description = "All events sent to stderr"
    event_types = ["*"]
    format      = "cloudevents-json"
  }

  sink {
    name        = "worker-audit-sink"
    description = "All events sent to a file"
    event_types = ["*"]
    format      = "cloudevents-json"

    file {
      path      = "/logs"
      file_name = "worker.log"
    }

    audit_config {
      audit_filter_overrides {
        secret    = "encrypt"
        sensitive = "hmac-sha256"
      }
    }
  }
}
Save this file.
This configuration is nearly identical to the controller event sink. It sends
all events to stderr in the cloudevents-json format, and defines a file sink
for all event types ("*"), instead of just audit events. It will save the file
as auditlogs/worker.log in the shared docker-compose directory, like the
controller does.
Restart the worker container.
$ docker compose restart worker
[+] Running 1/1
 ⠿ Container boundary-worker-1  Started
Thie worker primarily logs events from connection errors, such as when the
worker attempts to dial the worker on port 9201. This may happen when either
the controller or worker are restarted.
Examine the auditevents/worker.log file. It should contain a single
createClientConn event from when the worker established a connection with the
controller upon restart.
Restart the controller container.
$ docker compose restart controller
[+] Running 1/1
 ⠿ Container boundary-controller-1  Started
The worker.log file should now contain several authentication events, including worker has successfully authenticated. Other worker events will be logged here in the future, including credential rotations with the message worker credentials rotated.
Event Visualization
Event visualization enables operators to source data in various formats and then search, analyze and visualize that data in real time. Elastic provides a common architecture for event visualization built on the "elastic stack", or an "ELK stack". Typically this setup is comprised of Elasticsearch, Kibana, Beats, and Logstash.
This tutorial utilizes an "EFK" stack, where Logstash is replaced with Filebeat for collecting and sending event logs to Elasticsearch. Kibana is a frontend application that provides search and visualization for the events indexed by Elasticsearch.
Configure Kibana
Kibana is pre-configured for this tutorial. You do not need to set up Elasticsearch or Kibana.
If you want to learn more about how Elasticsearch and Kibana were deployed, examine the following files:
auditlogs/: A shared directory for log files.deploy: A script used to deploy and tear down the EFK stack.filebeat.docker.yml: The filbeat config for sending event logs to elasticsearchcompose/docker-compose.yml: The Docker-Compose configuration file describing how to provision and network the EFK stack containers.compose/.env: A set of tunable environment variables for deploying Elasticsearch and Kibana.
The compose/docker-compose file describes the configurations for the
setup-elastic, elasticsearch, kibana and filebeat containers. Filebeat
has a dedicated config file located at
learn-boundary-event-logging/filebeat.docker.yml. A set of environment
variables that control the deployment are located in compose/.env. In order to
provide access for Elasticsearch to the logs created by Docker, the deploy
script changes the permissions on the auditlogs/ directory to allow read and
write access to everyone.
This basic Elasticsearch configuration utilizes Filebeat to send all .log
files from the auditlogs/ directory to https://elasticsearch:9200, where
Elasticsearch is listening for data sources. Kibana acts as a frontend for
Elasticsearch, and is accessible on http://localhost:5601.
This configuration is already correct.
Open your web browser and navigate to http://localhost:5601/app/management/kibana/dataViews to view the Kibana dashboard.
Log in using the following credentials (these are defined in compose/.env):
- Email or username:
elastic - Password:
elastic
Create a data view
Upon logging in you should be presented with the page stating "You have data is Elasticsearch", prompting you to create a new data view. If you do not see this page, visit http://localhost:5601/app/management/kibana/dataViews directly.
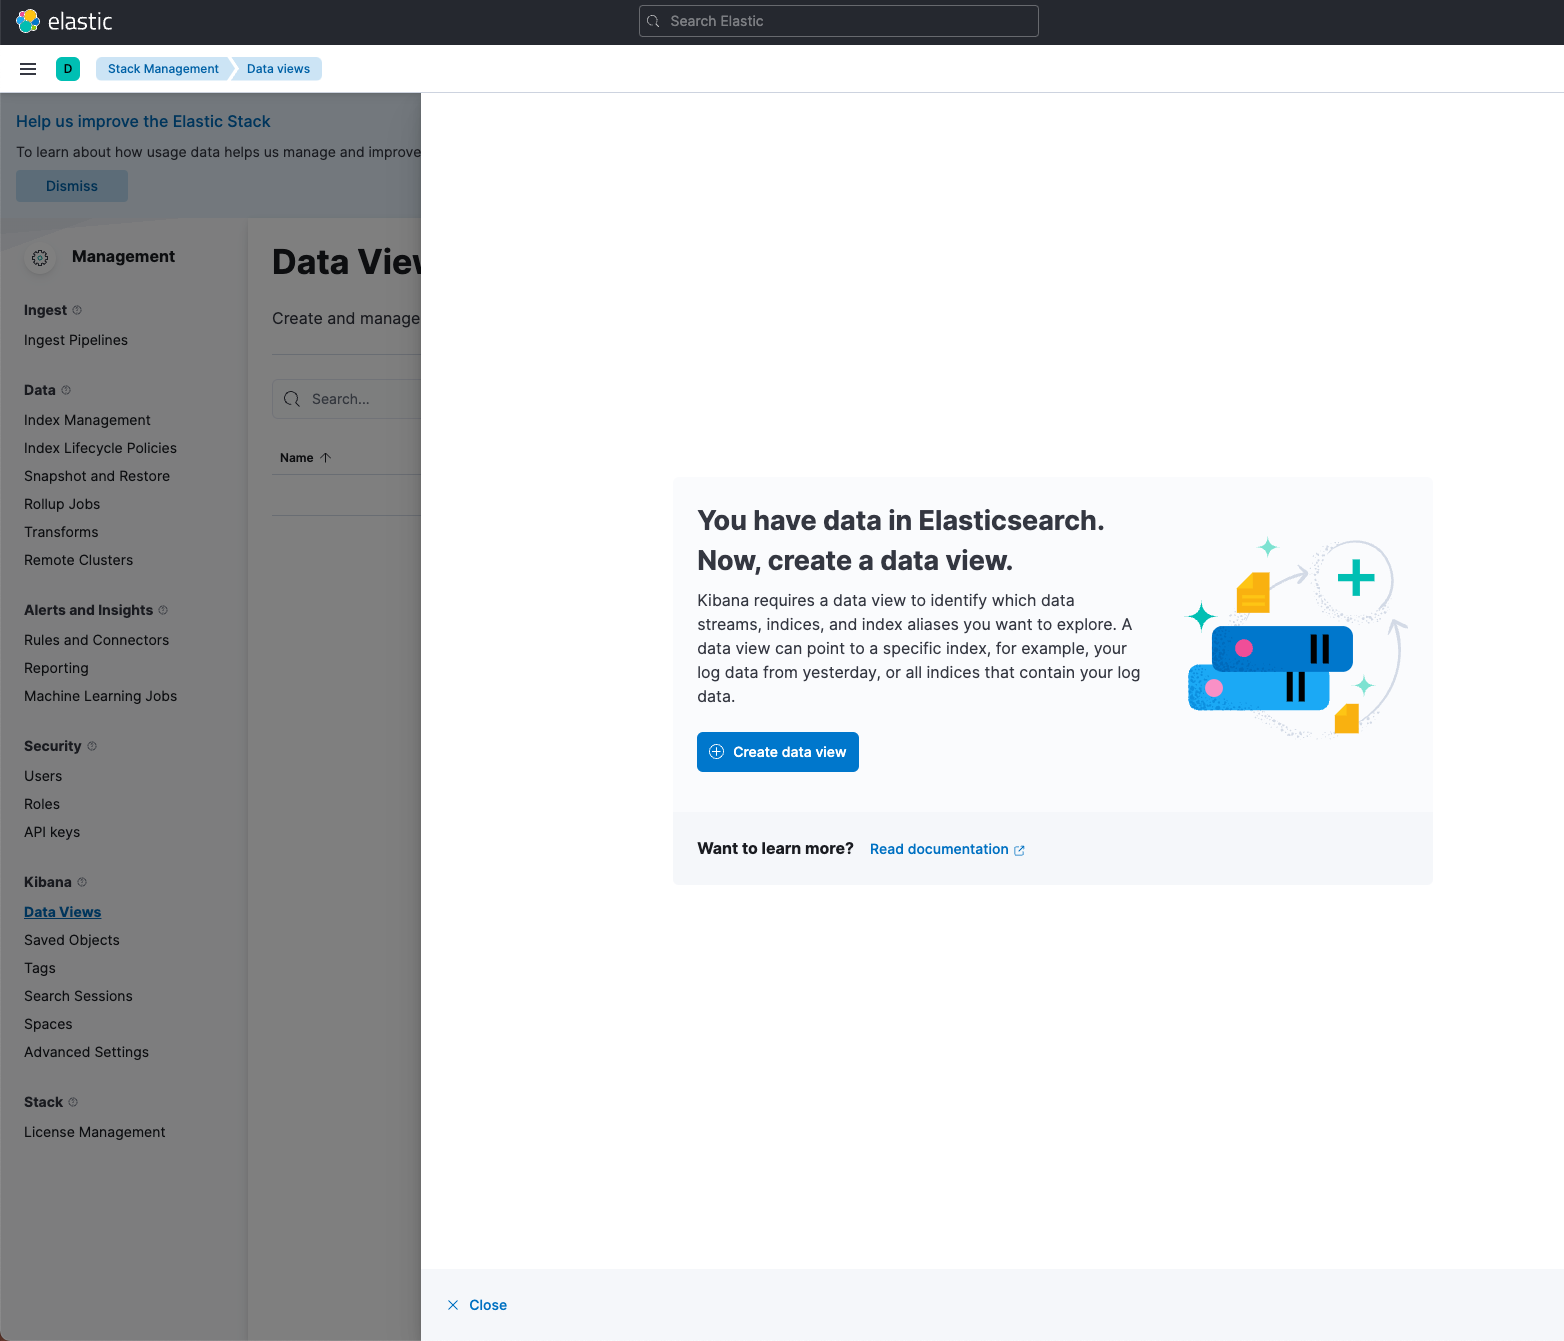
Click + Create data view.
Under the Create data view page, enter filebeat-* into the Name field. A
message should appear stating that "Your index pattern matches 1 source."
Leave the Timestamp field set to @timestamp. Click Create data view
when finished.
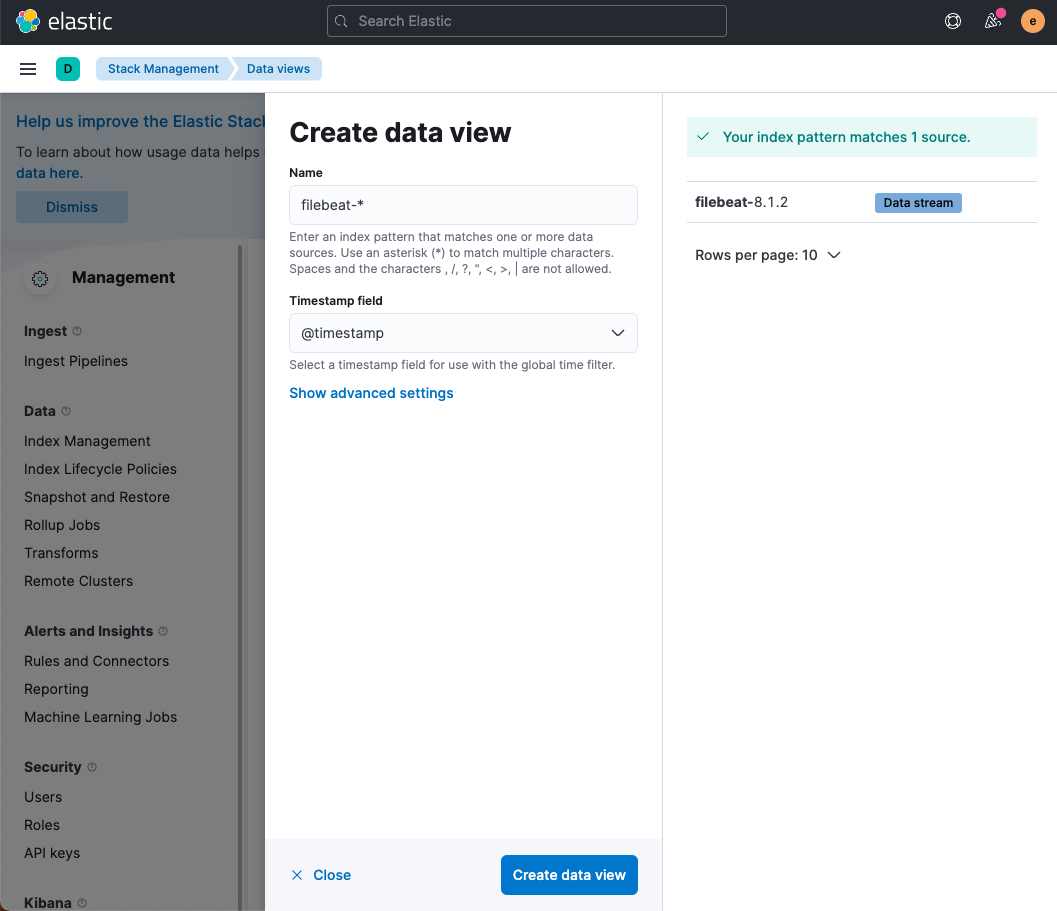
You will be redirected to the filebeat-* Management page.
Open a new browser tab, and navigate to http://localhost:5601/app/discover#.
The discover dashboard shows recent events, allowing you to inspect their details and search for events over a specific time period.
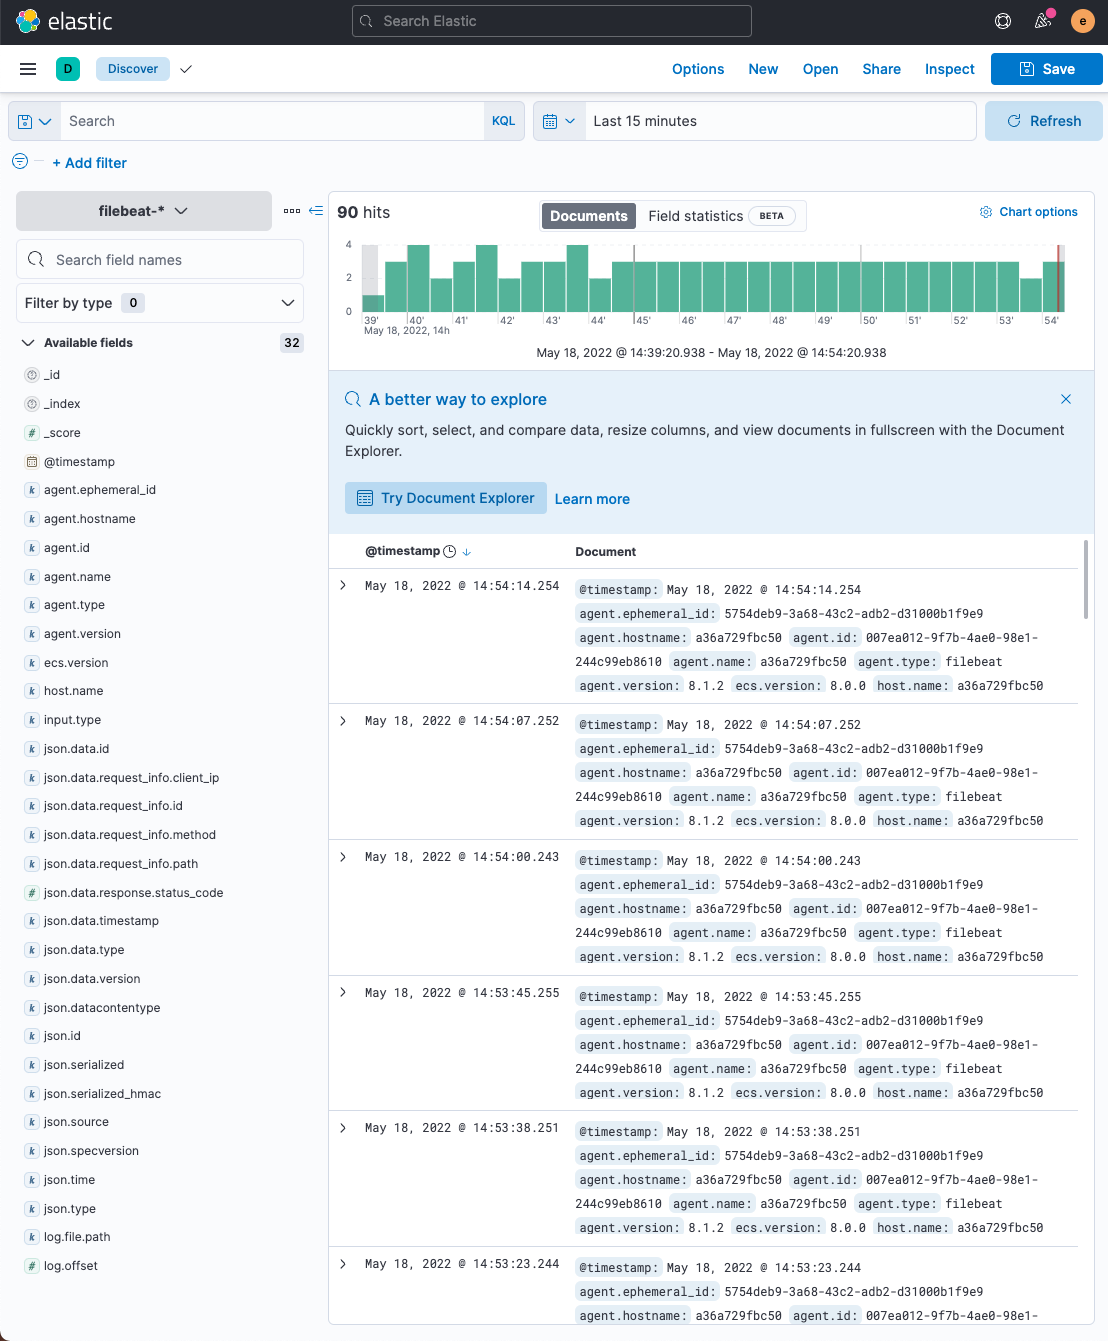
Visualize audit logs
Earlier the following file sinks were configured:
- auth-sink
- controller-audit-sink
- worker-audit-sink
- session-sink
These sinks resulted in the creation of the following files in the auditlogs/
directory:
This data has been imported into Kibana, and can be searched for in the Discover dashboard.
Similar to how the sink was written based on the content of the log entry,
common search queries can be constructed by examining the request_info.method
or request_info.path json data from the log.
Click on the Search box and then enter in the following query:
json.data.request_info.method : "/controller.servers.services.v1.SessionService/ActivateSession"
Click Update after the search query has been entered. If no results are displayed, adjust the Date range to Today.
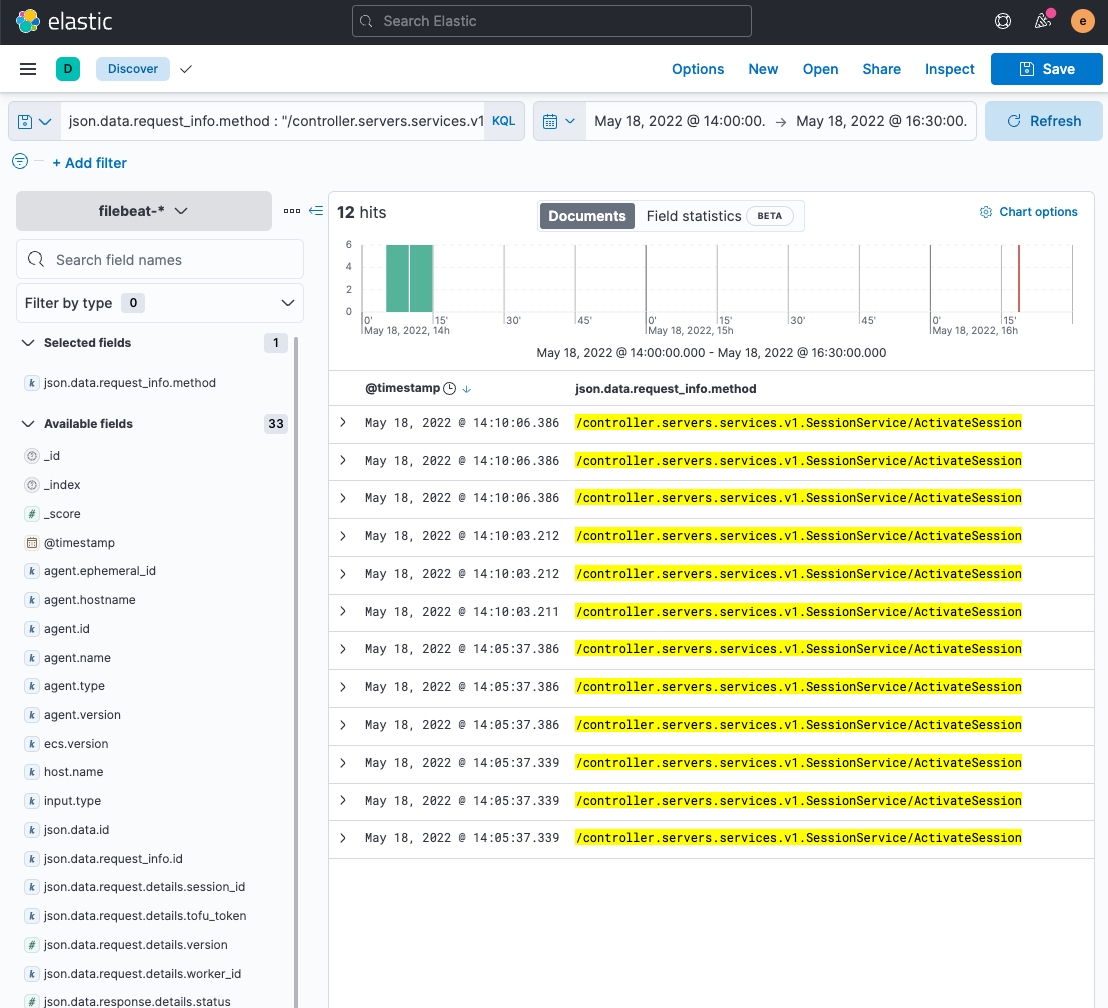
This view shows all log entries that describe a request made to the
v1/SessionService/ActivateSession endpoint.
Unlike Boundary's filtering syntax, KQL requires exact matching for search values (although fields can use wildcard and fuzzy matching). This means we cannot easily search for all entries containing ":activate", like the event sink does.
By default, Kibana uses the Kibana Query Language
(KQL) to parse
queries by default. KQL supports boolean and, or, and not operators to
create complex queries.
For KQL, this means searching for all the following events directly:
json.data.request_info.path: "/v1/targets/postgres:authorize-session"json.data.request_info.method: "/controller.servers.services.v1.SessionService/ActivateSession"json.data.request_info.method: "/controller.servers.services.v1.SessionService/AuthorizeConnection"json.data.request_info.method: "/controller.servers.services.v1.SessionService/CancelSession"json.data.request_info.method: "/controller.servers.services.v1.SessionService/CloseConnection"json.data.request_info.method: "/controller.servers.services.v1.SessionService/ConnectConnection"json.data.request_info.method: "/controller.servers.services.v1.SessionService/LookupSession"
To search for all the events collected by the session-sink file sink using
KQL, enter the following search query:
json.data.request_info.path: "/v1/targets/postgres:authorize-session" or json.data.request_info.method: "/controller.servers.services.v1.SessionService/ActivateSession" or json.data.request_info.method: "/controller.servers.services.v1.SessionService/AuthorizeConnection" or json.data.request_info.method: "/controller.servers.services.v1.SessionService/CancelSession" or json.data.request_info.method: "/controller.servers.services.v1.SessionService/CloseConnection" or json.data.request_info.method: "/controller.servers.services.v1.SessionService/ConnectConnection" or json.data.request_info.method: "/controller.servers.services.v1.SessionService/LookupSession"
This query may seem awkward. A simpler query can be made using Lucene query syntax, which accepts regular expressions in queries. Lucene is also built into Kibana, and can be enabled by disabling KQL.
Locate the KQL button to the right of the search bar.
Click on it, and the toggle the KQL switch off to enable Lucene.
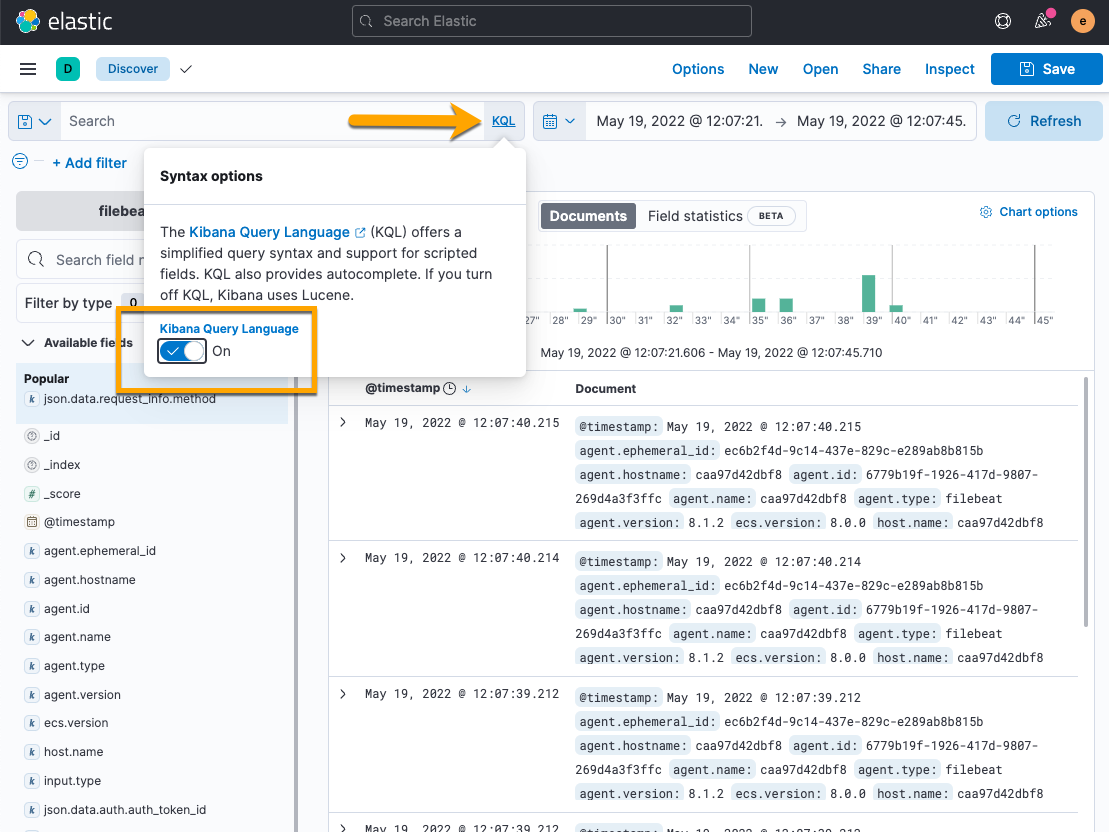
The KQL button should now be replaced with Lucene.
Enter the following Lucene query to search for the session-sink events:
json.data.request_info.method: /.*SessionService.*/ or json.data.request_info.path: /.*:authorize-session.*/
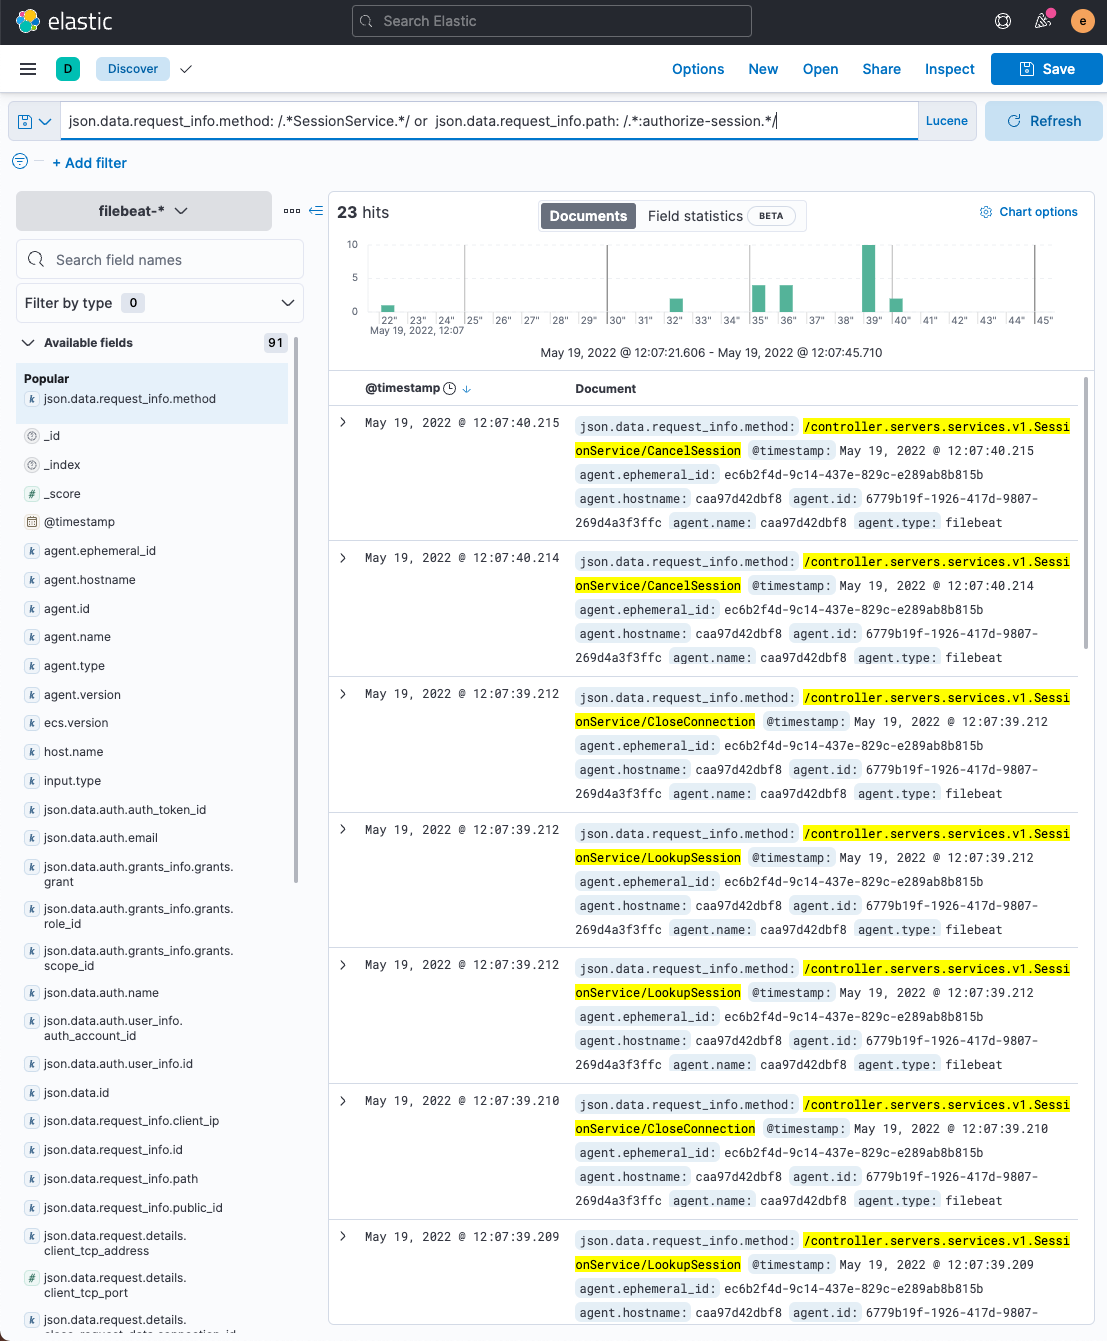
Both the KQL and Lucene searches will return all the events created by the session-sink filter:
"/data/request_info/path" contains ":authorize-session""/data/request_info/method" contains "SessionService"
Other useful information can also be gathered with Kibana, such as metrics related to health checks.
For example, the controller container has a healthcheck defined in the
compose/docker-compose.yml file. It queries the http://boundary:9203/health
endpoint every 10 seconds to determine if the controller is healthy:
healthcheck:
  test: ["CMD-SHELL", "wget --no-verbose --tries=1 --output-document /dev/null http://boundary:9203/health"]
  interval: 10s
  timeout: 5s
  retries: 5
To view these requests, perform the following search with Lucene:
json.data.request_info.path: /.*health*/
Click Update after the search query has been entered.
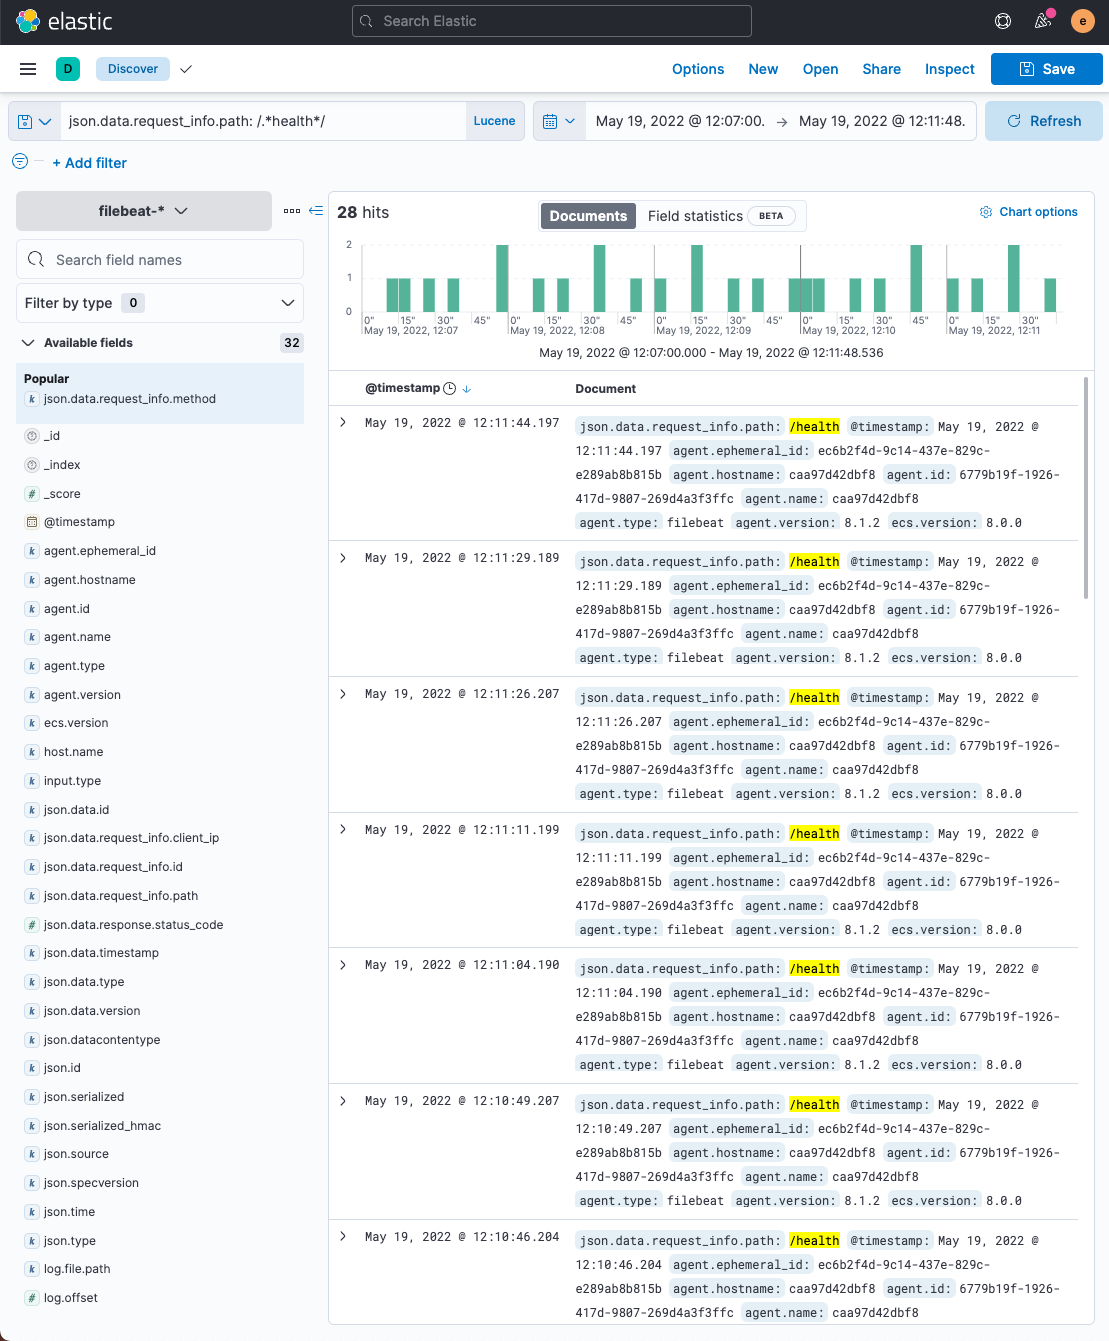
This query can also be perfomed using the following KQL query:
json.data.request_info.path : "/health"
Cleanup and teardown
The Boundary cluster containers and network resources can be cleaned up
using the provided deploy script.
$ ./deploy cleanup
~/learn-boundary-event-logging/compose ~/learn-boundary-event-logging
[+] Stopping 9/8
 ✔ Container boundary-kibana-1         Stopped                                                                5.2s
 ✔ Container boundary-postgres-1       Stopped                                                                0.1s
 ✔ Container boundary-worker-1         Stopped                                                                5.7s
 ✔ Container boundary-filebeat-1       Stopped                                                                0.2s
 ✔ Container boundary-elasticsearch-1  Stopped                                                                2.7s
 ✔ Container boundary-controller-1     Stopped                                                                0.2s
 ✔ Container boundary-db-init-1        Stopped                                                                0.0s
 ✔ Container boundary-db-1             Stopped                                                                0.2s
 ✔ Container boundary-setup-elastic-1  Stopped                                                                0.0s
Going to remove boundary-worker-1, boundary-controller-1, boundary-kibana-1, boundary-elasticsearch-1, boundary-db-init-1, boundary-setup-elastic-1, boundary-db-1, boundary-filebeat-1, boundary-postgres-1
[+] Removing 9/0
 ✔ Container boundary-postgres-1       Removed                                                                0.0s
 ✔ Container boundary-worker-1         Removed                                                                0.0s
 ✔ Container boundary-controller-1     Removed                                                                0.0s
 ✔ Container boundary-kibana-1         Removed                                                                0.0s
 ✔ Container boundary-elasticsearch-1  Removed                                                                0.0s
 ✔ Container boundary-db-init-1        Removed                                                                0.0s
 ✔ Container boundary-setup-elastic-1  Removed                                                                0.0s
 ✔ Container boundary-db-1             Removed                                                                0.0s
 ✔ Container boundary-filebeat-1       Removed                                                                0.0s
~/learn-boundary-event-logging
~/learn-boundary-event-logging/terraform ~/learn-boundary-event-logging
~/learn-boundary-event-logging
Check your work with a quick docker ps and ensure there are no more containers
with the boundary- prefix leftover. If unexpected containers still exist,
execute docker rm -f CONTAINER_NAME against each to remove them.